editorial
editorial
entrevista
interview
ágora
agora
tapete
carpet
artigo nomads
nomads paper
projeto
project
expediente
credits
próxima v!rus
next v!rus
REVISTA V!RUS V!RUS JOURNAL
issn 2175-974x
dezembro . december 2020

Projeto Remote Design Studio: relatório final
Marcelo Tramontano é Arquiteto, Mestre, Doutor e Livre-docente em Arquitetura e Urbanismo, com Pós-doutorado em Arquitetura e Mídias Digitais. É Professor Associado do Instituto de Arquitetura e Urbanismo da Universidade de São Paulo, e do Programa de Pós-graduação em Arquitetura e Urbanismo da mesma instituição. Coordena o Nomads.usp e é Editor-chefe da revista V!RUS. tramont@sc.usp.br http://lattes.cnpq.br/1999154589439118
Mario Vallejo é bacharel em Desenho Arquitetônico e de Engenharia e Mestre em Arquitetura e Urbanismo. É pesquisador no Nomads.usp e doutorando no Programa de Pós-graduação em Arquitetura e Urbanismo do Instituto de Arquitetura e Urbanismo da Universidade de São Paulo. Estuda processos digitais de projeto, colaboração, BIM, e métodos e meios de representação. mariovallejo@usp.br http://lattes.cnpq.br/1094158283404582
Maurício José da Silva Filho é arquiteto e urbanista e pesquisador no Nomads.usp, do Programa de Pós-Graduação em Arquitetura e Urbanismo do Instituto de Arquitetura e Urbanismo da Universidade de São Paulo, e graduando em Sistemas da Informação na mesma universidade. Estuda o emprego de meios digitais – design paramétrico e fabricação digital – no processo de projeto de arquitetura. mauricio.jose.filho@usp.br http://lattes.cnpq.br/7246231958331765
Danilo Cazentini Medeiros é arquiteto e urbanista, designer e ilustrador, especialista em design de interiores. Atualmente é Head of Design da empresa Cross Reality Educacross e pesquisador no Nomads.usp, do Programa de Pós-graduação em Arquitetura e Urbanismo do Instituto de Arquitetura e Urbanismo da Universidade de São Paulo, investigando modos de representação no processo de projeto. dan.medeiros@usp.br http://lattes.cnpq.br/7546949898123957
Como citar esse texto: TRAMONTANO, M.; VALLEJO, M.; SILVA FILHO, M. J.; MEDEIROS, D. C. Projeto Remote Design Studios: relatório final. V!RUS, São Carlos, n. 21, Semestre 2, dezembro, 2020. [online]. Disponível em: <http://www.nomads.usp.br/virus/virus21/?sec=6&item=1&lang=pt>. Acesso em: 29 Abr. 2024.
Resumo
Este trabalho corresponde ao relatório final do projeto Remote Design Studios (RDS), que apresenta os resultados de consulta feita a professores de projeto de arquitetura, urbanismo e paisagismo de instituições de ensino superior. A consulta reuniu informações sobre a realização de atividades remotas online de ensino de projeto durante o primeiro semestre letivo da pandemia de Covid-19. A consulta foi realizada por pesquisadores do Nomads.usp - Núcleo de Estudos em Habitares Interativos da Universidade de São Paulo, no período de junho a agosto de 2020, e contou com 166 respondentes de instituições de 14 países. As informações apresentadas neste relatório são referentes aos respondentes vinculados a instituições de ensino do Brasil, situadas em 14 estados brasileiros. A metodologia empregou consulta, por meio de questionário online, reuniu trabalhos discentes, quando disponibilizados pelos entrevistados, e sugestões de aplicativos computacionais específicos que oferecessem facilidades para o processo de projeto à distância.
Palavras-chave: Ensino de Projeto, Ensino Remoto, Covid-19, Enquete
Os questionários referentes ao projeto Remote Design Studios (RDS) foram disponibilizados aos entrevistados em Português, Inglês e Espanhol e podem ser acessados nos endereços:
Português: https://bit.ly/3eDAQCC
Inglês: https://bit.ly/3i5daJt
Espanhol: https://bit.ly/2ZdVCSL
1 Introdução
A pandemia do novo coronavírus impactou as relações sociais em diferentes âmbitos da vida cotidiana. A nova realidade impôs restrições de uso e de acesso a espaços coletivos, locais onde frequentemente ocorriam intensas trocas e relações entre os indivíduos. As atividades do meio acadêmico estão dentre as que sofreram restrições de acesso e suspensão: em maio de 2020, o Instituto Internacional para a Educação Superior na América Latina e Caribe (IESALC, órgão da UNESCO) estimou, em relatório, que, apenas na América Latina e Caribe, o fechamento temporário de Instituições de Ensino Superior já havia afetado 23,4 milhões de estudantes e 1,4 milhão de docentes. Isto representava, na época, “mais de 98% da população de estudantes e professores da educação superior da região.” (UNESCO, 2020, p. 12).
No Brasil, a portaria Nº 343, do Ministério da Educação, autorizou, desde 17 de março de 2020, “em caráter excepcional, a substituição das disciplinas presenciais, em andamento, por aulas que utilizem meios e tecnologias de informação e comunicação” (BRASIL, 2020). Embora esta portaria contemple as Instituições de Ensino Superior do Sistema Federal de Ensino, outras instituições públicas e privadas de diferentes esferas administrativas também tiveram que se adequar. Várias delas simplesmente suspenderam as atividades didáticas, enquanto diversas instituições públicas e privadas implementaram uma modalidade remota de ensino que se diferencia tanto da modalidade presencial, quanto do chamado ensino à distância, ou EAD.
Foi neste contexto que o Nomads.usp - Núcleo de Estudos em Habitares Interativos, do Instituto de Arquitetura e Urbanismo da Universidade de São Paulo (IAU-USP) realizou a pesquisa Remote Design Studios (RDS), consultando professores de projeto de arquitetura, urbanismo e paisagismo sobre modos de comunicação e procedimentos didático-pedagógicos em disciplinas de graduação não-presenciais ministradas durante o primeiro semestre da pandemia de Covid-191. A consulta foi realizada através de questionário online e este relatório visa disponibilizar publicamente parte dos dados brutos obtidos entre os dias 24 de junho e 10 de agosto de 2020.
A Dra. Patrícia Alejandra Behar, Professora Titular da Faculdade de Educação da Universidade Federal do Rio Grande do Sul e pesquisadora na área de modelos pedagógicos para EAD e Informática na Educação, escreve que, no contexto da pandemia de coronavírus:
“Foi preciso pensar em atividades pedagógicas mediadas pelo uso da Internet, pontuais e aplicadas em função das restrições impostas pela Covid-19 para minimizar os impactos na aprendizagem advindos do ensino presencial. O currículo da maior parte das instituições educacionais não foi criado para ser aplicado remotamente.” (BEHAR, 2020, n.p, grifo nosso)
Alunos e professores foram confrontados a um conjunto de questões e incertezas advindas da necessidade de adaptação de atividades presenciais para a modalidade remota. Embora essas adaptações tenham ocorrido nas diferentes áreas do conhecimento, destacamos impactos significativos para as disciplinas e atividades ligadas a uma formação teórico-prática. Esse destaque já havia sido apontado em maio de 2020, no relatório do IESALC:
“as disciplinas que buscam desenvolver habilidades profissionais por meio da prática (clínicas, residências pedagógicas, carreiras de design, engenharias, ciências e, em geral, todas aquelas fortemente dependentes de oficinas práticas, trabalhos de laboratório ou práticas institucionais) geram maiores incertezas, o que resultará em uma série de efeitos diferenciadores em cada universidade e em escala sistêmica." (UNESCO, 2020, p. 23, grifo nosso).
De fato, desde o início da suspensão de atividades presenciais nas univeridades, o ensino de arquitetura e urbanismo e, especificamente, o de projeto viu-se diante do questionamento sobre como seria possível realizar, de maneira remota, as atividades que tipicamente se pautam em exercícios práticos e discussões que envolvem meios como o desenho e a produção de modelos (físicos e digitais), os quais são comentados, criticados e retrabalhados coletiva e sincronamente. Além disso, a formação de arquitetos e urbanistas frequentemente pressupõe visitas a campo e canteiros de obra, atividades que colocam alunos e professores em contato com outros agentes e etapas do processo de projeto, seja na escala arquitetônica, urbana ou paisagística.
Há, por outro lado, uma prática pouco sistematizada e, em todo caso, pouco conhecida no Brasil, que envolve arquitetos trabalhando à distância em escritórios de arquitetura sobretudo de países industrializados, desde antes da atual pandemia. Compõem equipes de projeto que pouco ou nunca se encontram presencialmente, trabalhando tanto em grandes projetos internacionais, quanto em intervenções de escala local. Essa prática já se apoiava no uso de programas BIM e discussões por videoconferência, e tornou-se uma referência este ano para, por exemplo, escritórios franceses obrigados por lei ao teletrabalho (CRABIÉ, 2020). À asserção, muito ouvida entre docentes, de que não é possível ensinar projeto de arquitetura em modalidade remota, opõe-se, assim, a pergunta "Como formar arquitetos para compor tais equipes, habilitados a desenvolver projetos colaborativamente à distância?".
Este relatório se estrutura em três partes principais: 1] os objetivos do projeto, 2] os procedimentos metodológicos empregados e 3] os resultados obtidos. Os objetivos e procedimentos metodológicos estão descritos em itens específicos (itens 2 e 3, respectivamente). A apresentação dos resultados está dividida em três itens subsequentes que visam: caracterizar o conjunto de respondentes (item 4); apresentar uma leitura das respostas destacando as porcentagens mais expressivas para cada uma das perguntas do questionário (específicos dos respondentes vinculados a instituições de ensino brasileiras, item 5); e apresentar o levantamento de aplicativos específicos que oferecem facilidades para discussões online de projeto (realizado a partir tanto de respondentes vinculados a instituições de ensino brasileiras, quanto internacionais, além da contribuição de pesquisadores do Nomads.usp, item 6).
2Objetivos
O projeto teve como objetivo produzir uma visão geral sobre modos de ensino remoto de projeto de arquitetura, urbanismo e paisagismo, durante a pandemia da Covid-19. Para tanto, foram consultadas professoras e professores de disciplinas de projeto de arquitetura, urbanismo e paisagismo do Brasil, além de outros países da América Latina, e de alguns países de outros continentes. Pretendia-se que as respostas ao questionário fornecessem dados que permitissem:
i. Produzir uma overview sobre modos de ensino remoto de projeto de arquitetura, urbanismo e paisagismo, durante a pandemia da Covid-19;
ii. Contribuir para a formulação de disciplinas remotas de projeto a serem oferecidas durante o período de confinamento;
iii. Ampliar a reflexão sobre atividades colaborativas online no ensino de projeto;
iv. Contribuir para a discussão sobre a inclusão de estruturas híbridas presenciais/remotas em disciplinas regulares de projeto; e
v. Estimular a interlocução sobre o assunto, divulgando resultados em fóruns acadêmicos.
3 Procedimentos metodológicos e atividades realizadas
Os principais procedimentos metodológicos foram: consulta através de questionário; sistematização e análise de dados coletados; e investigação exploratória de programas computacionais. As atividades realizadas incluíram: 3.1. Elaboração e divulgação do questionário; 3.2. Leitura, sistematização e análise dos dados coletados; e 3.3. Teste e exploração de programas computacionais.´
3.1Elaboração e divulgação do questionário
O questionário online foi elaborado utilizando a ferramenta Google Form. As perguntas foram definidas em reunião remota dos pesquisadores envolvidos no projeto. O questionário final incluiu, além de informações pessoais e profissionais (nome, e-mail e instituição) dos respondentes, perguntas das seguintes naturezas:
i. Sobre a caracterização das atividades realizadas: questões referentes à escala e abrangência dos exercícios desenvolvidos e à natureza das atividades realizadas. Para cada pergunta era apresentada uma lista de opções para as quais os respondentes deveriam indicar seu uso escolhendo entre as opções de resposta Sim ou Não;
ii. Sobre os programas computacionais: questões referentes ao uso de programas computacionais, tanto para representação e modelagem de projetos, quanto para a comunicação entre alunos e professores nas atividades remotas. Foram apresentadas listas de programas computacionais e de aplicativos de comunicação, e os respondentes deveriam indicar o seu uso de acordo com as categorias: Principalmente, Complementarmente, e Não foi utilizado;
iii. Sobre as dinâmicas das disciplinas: questões referentes à estruturação da disciplina e à dinâmica das aulas. Para estas perguntas os respondentes deveriam selecionar uma alternativa dentre um conjunto pré definido que lhe era apresentado;
iv. Sobre os alunos e seus recursos: questões referentes à postura dos alunos nas atividades remotas, bem como aos recursos que eles tinham disponíveis segundo avaliação dos respondentes. Estes deveriam indicar respostas Sim ou Não para cada uma das perguntas apresentadas;
v. Avaliações preliminares: levantou as percepções dos respondentes acerca das atividades realizadas. Neste caso, foram apresentadas afirmações sobre as atividades realizadas e seus produtos e os respondentes deveriam indicar seu grau de concordância, selecionando uma dentre as opções: Concordo plenamente; Concordo parcialmente; Tendo a discordar; ou Discordo totalmente.
Além das perguntas de múltipla escolha, também foram feitas duas perguntas abertas: uma, solicitando que fossem indicados aplicativos de comunicação específicos que oferecessem facilidades para discussões de projeto (possibilidade de anotações sobre desenho dos alunos, possibilidade de desenho à mão, etc.); e outra questão pedindo que os respondentes fizessem sugestões sobre como aperfeiçoar as disciplinas remotas de ensino de projeto.
As perguntas de cada eixo temático do questionário foram desenvolvidas em reuniões com os pesquisadores envolvidos no projeto e, uma vez definidas, foram divulgadas a todos os pesquisadores do Nomads.usp. Nesta etapa, todos os pesquisadores do Núcleo, de diferentes graus de formação, poderiam avaliar as perguntas, criticá-las e propor sugestões ou correções que julgassem pertinentes. Após esta etapa, o link para o questionário passou à divulgação pública, acompanhado de um texto de apresentação e um flyer oficial. Houve três estratégias fundamentais de divulgação: através de publicação nas redes sociais do Nomads.usp e por pesquisadores do Núcleo; através de e-mail a programas de pós-graduação em Arquitetura e Urbanismo e diretores de cursos de graduação, solicitando que a mensagem fosse repassada potenciais interessados; e através de e-mails individuais a docentes no Brasil e no Exterior, selecionados em anais de eventos científicos e congressos, e de websites de instituições de ensino superior que oferecessem a formação em arquitetura e urbanismo.
3.2.Leitura e sistematização de dados
Após a publicização dos questionários, entre junho e julho de 2020, passou-se à leitura e sistematização das respostas recebidas até o dia 10 de agosto de 2020. Os dados foram sistematizados em planilhas, e geraram gráficos que estão apresentados nos tópicos 4 e 5 deste relatório. As respostas às questões abertas, relativas aos aplicativos adequados às discussões projetuais, auxiliaram no preenchimento da tabela apresentada no item 6. No caso das questões abertas para sugestões de aperfeiçoamento das disciplinas remotas de ensino de projeto, as respostas e reflexões não serão incluídas neste relatório. Indicamos a leitura do artigo "Remoto online, ensino de projeto: lições de uma pandemia" (TRAMONTANO et al., 2020), que dedicou-se a discutir estas sugestões dos respondentes.
3.3.Teste e exploração de programas
A partir das respostas dos entrevistados, foi elencado um conjunto de aplicativos computacionais utilizados por professores em práticas de ensino de projeto. Foram selecionados aplicativos para uma fase exploratória, conduzida pela equipe de pesquisadores do projeto. Os aplicativos selecionados deveriam estar relacionados simultaneamente à comunicação e à possibilidade de representação e discussão de projetos arquitetônicos. Para a sua exploração, foram realizadas sessões de comunicação síncrona entre os pesquisadores, utilizando-se os programas sugeridos e projetos de arquitetura e urbanismo.
4Sobre os respondentes
O questionário destinava-se a professores de instituições de ensino superior públicas e privadas no Brasil e no Exterior. Ao final do período de divulgação, além das outras formas de divulgação já citadas anteriormente, haviam sido enviados 655 e-mails a professores convidando-os a responder o questionário. Desses e-mails, 359 foram destinados a professores de instituições de ensino brasileiras, 220 de instituições de outros países da América Latina e 76 de países de outras regiões do globo. Como resultado, até o dia 10 de agosto de 2020, os questionários haviam tido 166 respondentes, sendo 124 do Brasil, 34 de outros países da América Latina e 8 de países de outras regiões.
O conjunto de respondentes cobre 14 países, sendo o Brasil acompanhado de outros 7 países da América Latina e 6 países de outras regiões do mundo. No caso da América Latina (sem considerar o Brasil), o grupo de respondentes cobre 17 instituições de ensino, sendo que a Colômbia apresentou o maior número de respondentes da região (12 respondentes) e também o maior número de instituições representadas (5 instituições). Os outros países da América Latina (sem considerar o Brasil) foram México, Peru, Argentina, Chile, Uruguai e Equador. A figura 1 apresenta um quadro completo dos países com o número de respondentes e instituições representadas.
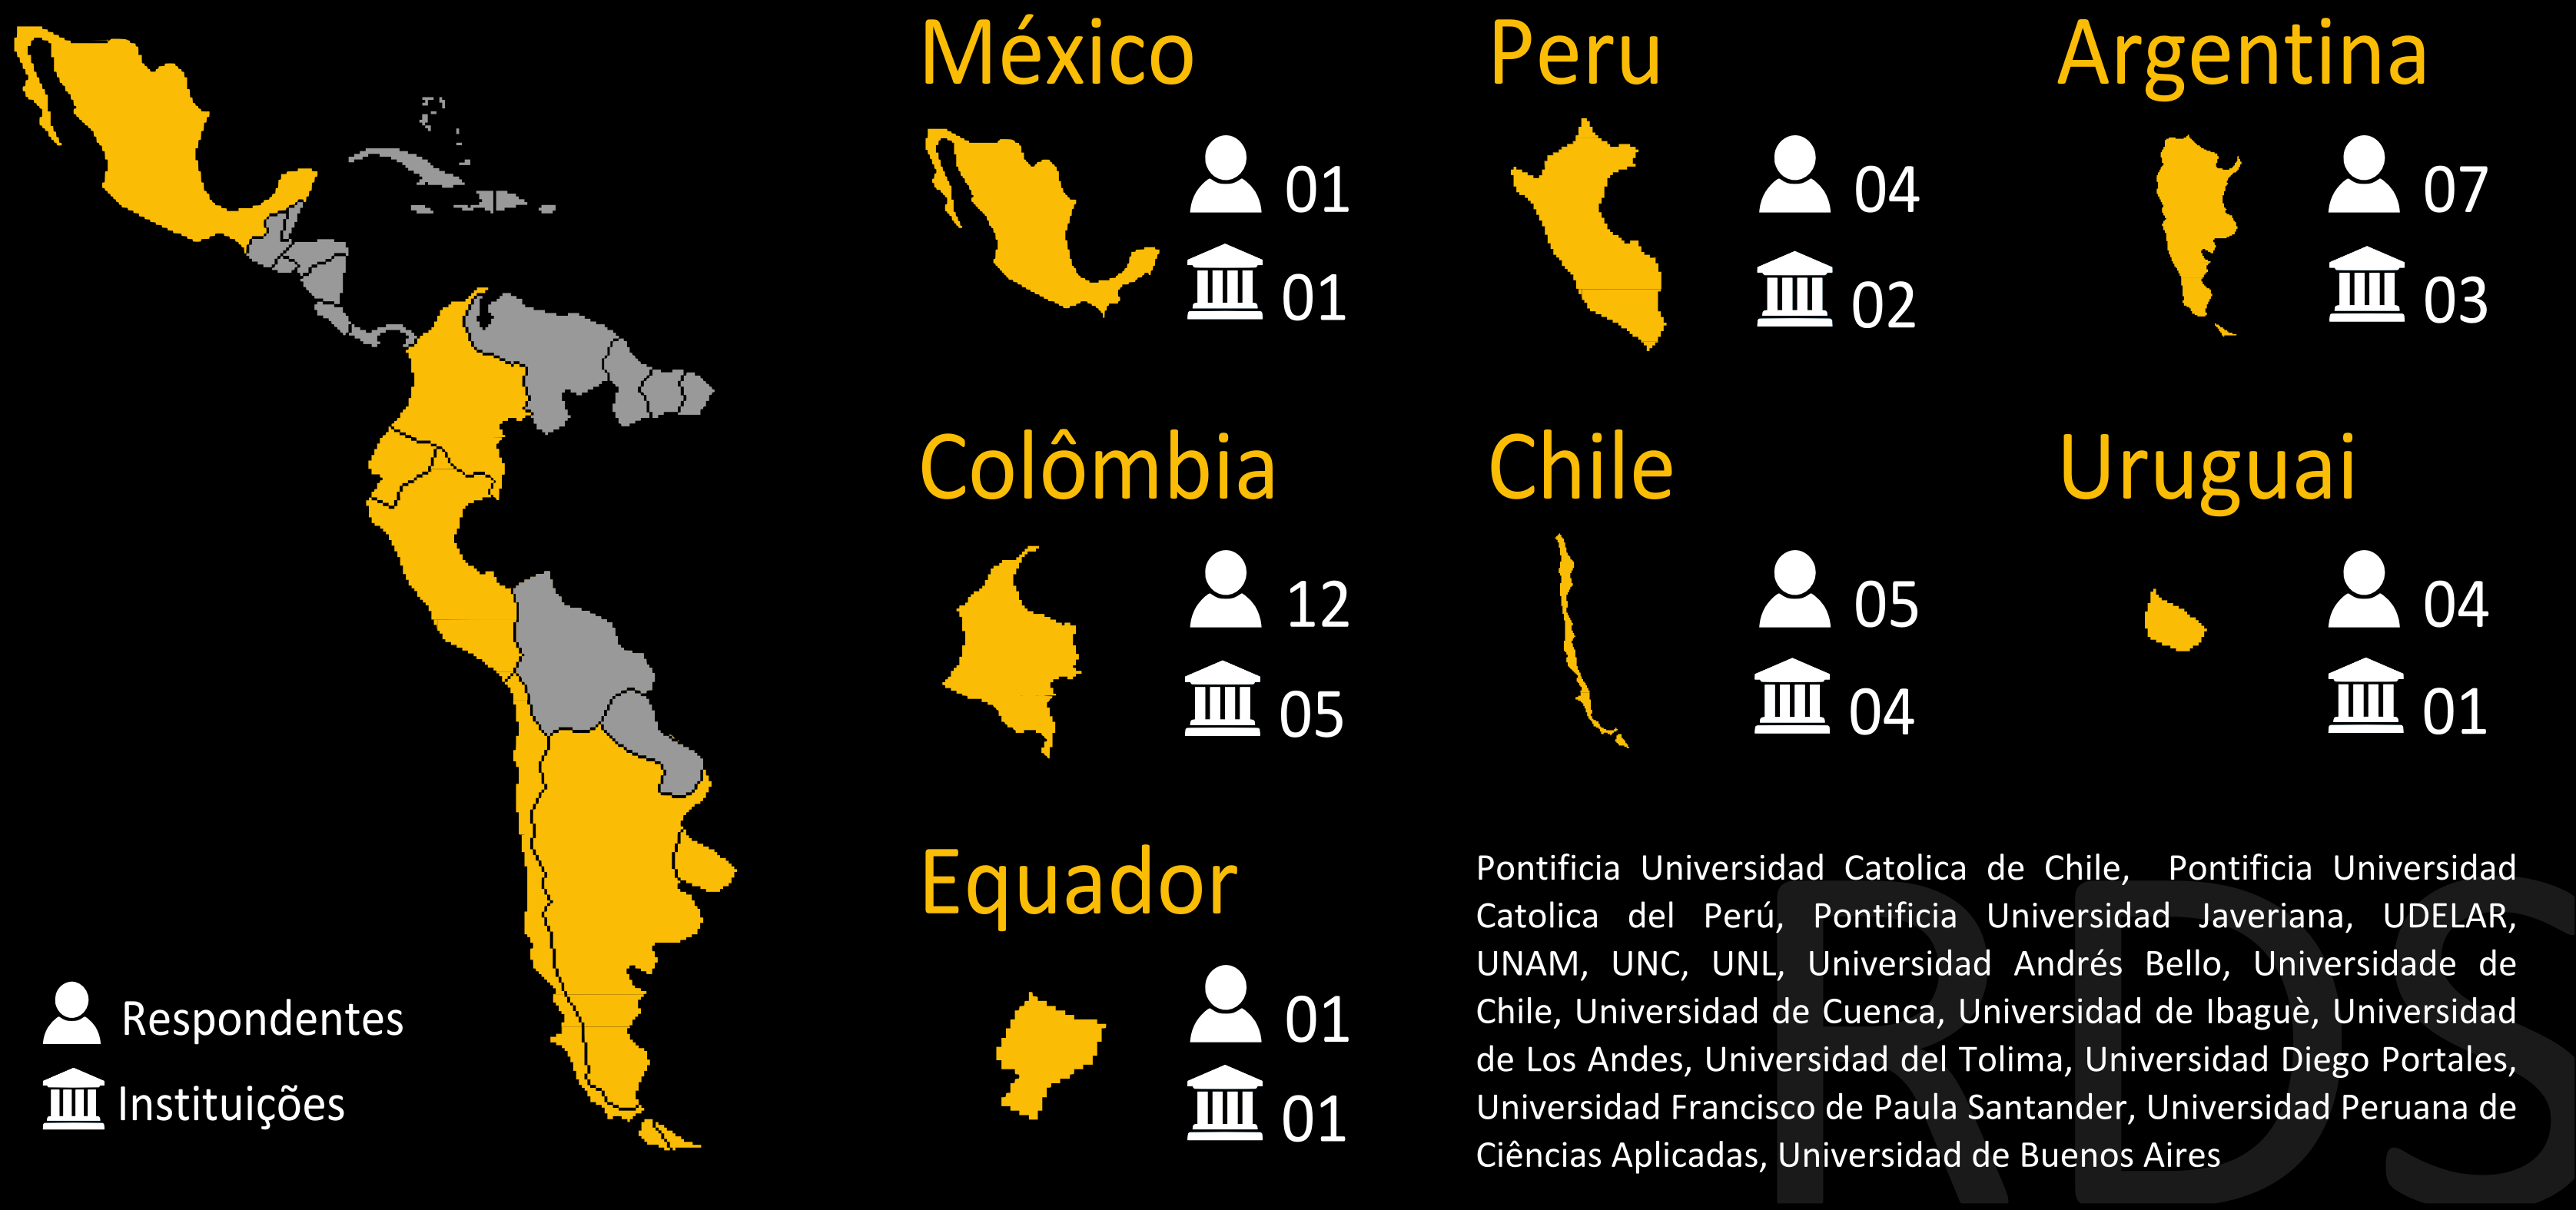
Fig. 1: Países da América Latina (sem considerar o Brasil) com destaque para aqueles que tiveram respondentes na enquete. Total de respondentes e de instituições por país, além da lista das instituições no canto inferior direito. Fonte: Autores, 2020.
No que diz respeito ao Brasil, o número de respondentes cobriu 14 estados, de 4 regiões do país (Nordeste, Centro-Oeste, Sudeste e Sul). O conjunto totaliza 124 respondentes de 62 instituições. O estado com maior número de respondentes foi São Paulo, com 63 respondentes de 23 instituições. Dentre as instituições que tiveram respondentes, 73% são privadas e 27% são públicas. Destaca-se, ainda, que 14 grandes instituições públicas brasileiras enviaram-nos informações importantes, apesar de não terem oferecido disciplinas remotas no primeiro semestre de 2020.
As instituições públicas com maior número de respondentes foram a Faculdade de Arquitetura e Urbanismo da Universidade de São Paulo (FAU-USP), seguida pela Universidade Federal de Mato Grosso do Sul (UFMS) e pela Universidade Estadual de Campinas (UNICAMP). Dentre as instituições privadas de ensino, as que tiveram maior número de respondentes foram a Universidade Presbiteriana Mackenzie, a Universidade Paulista (Unip), a Pontifícia Universidade Católica de Minas Gerais (PUC-MG) e a Pontifícia Universidade Católica do Rio de Janeiro (PUC - RJ). A figura 2 apresenta um quadro completo com informações sobre as instituições e respondentes no Brasil, bem como a lista das universidades que tiveram respondentes até 10 de agosto de 2020.
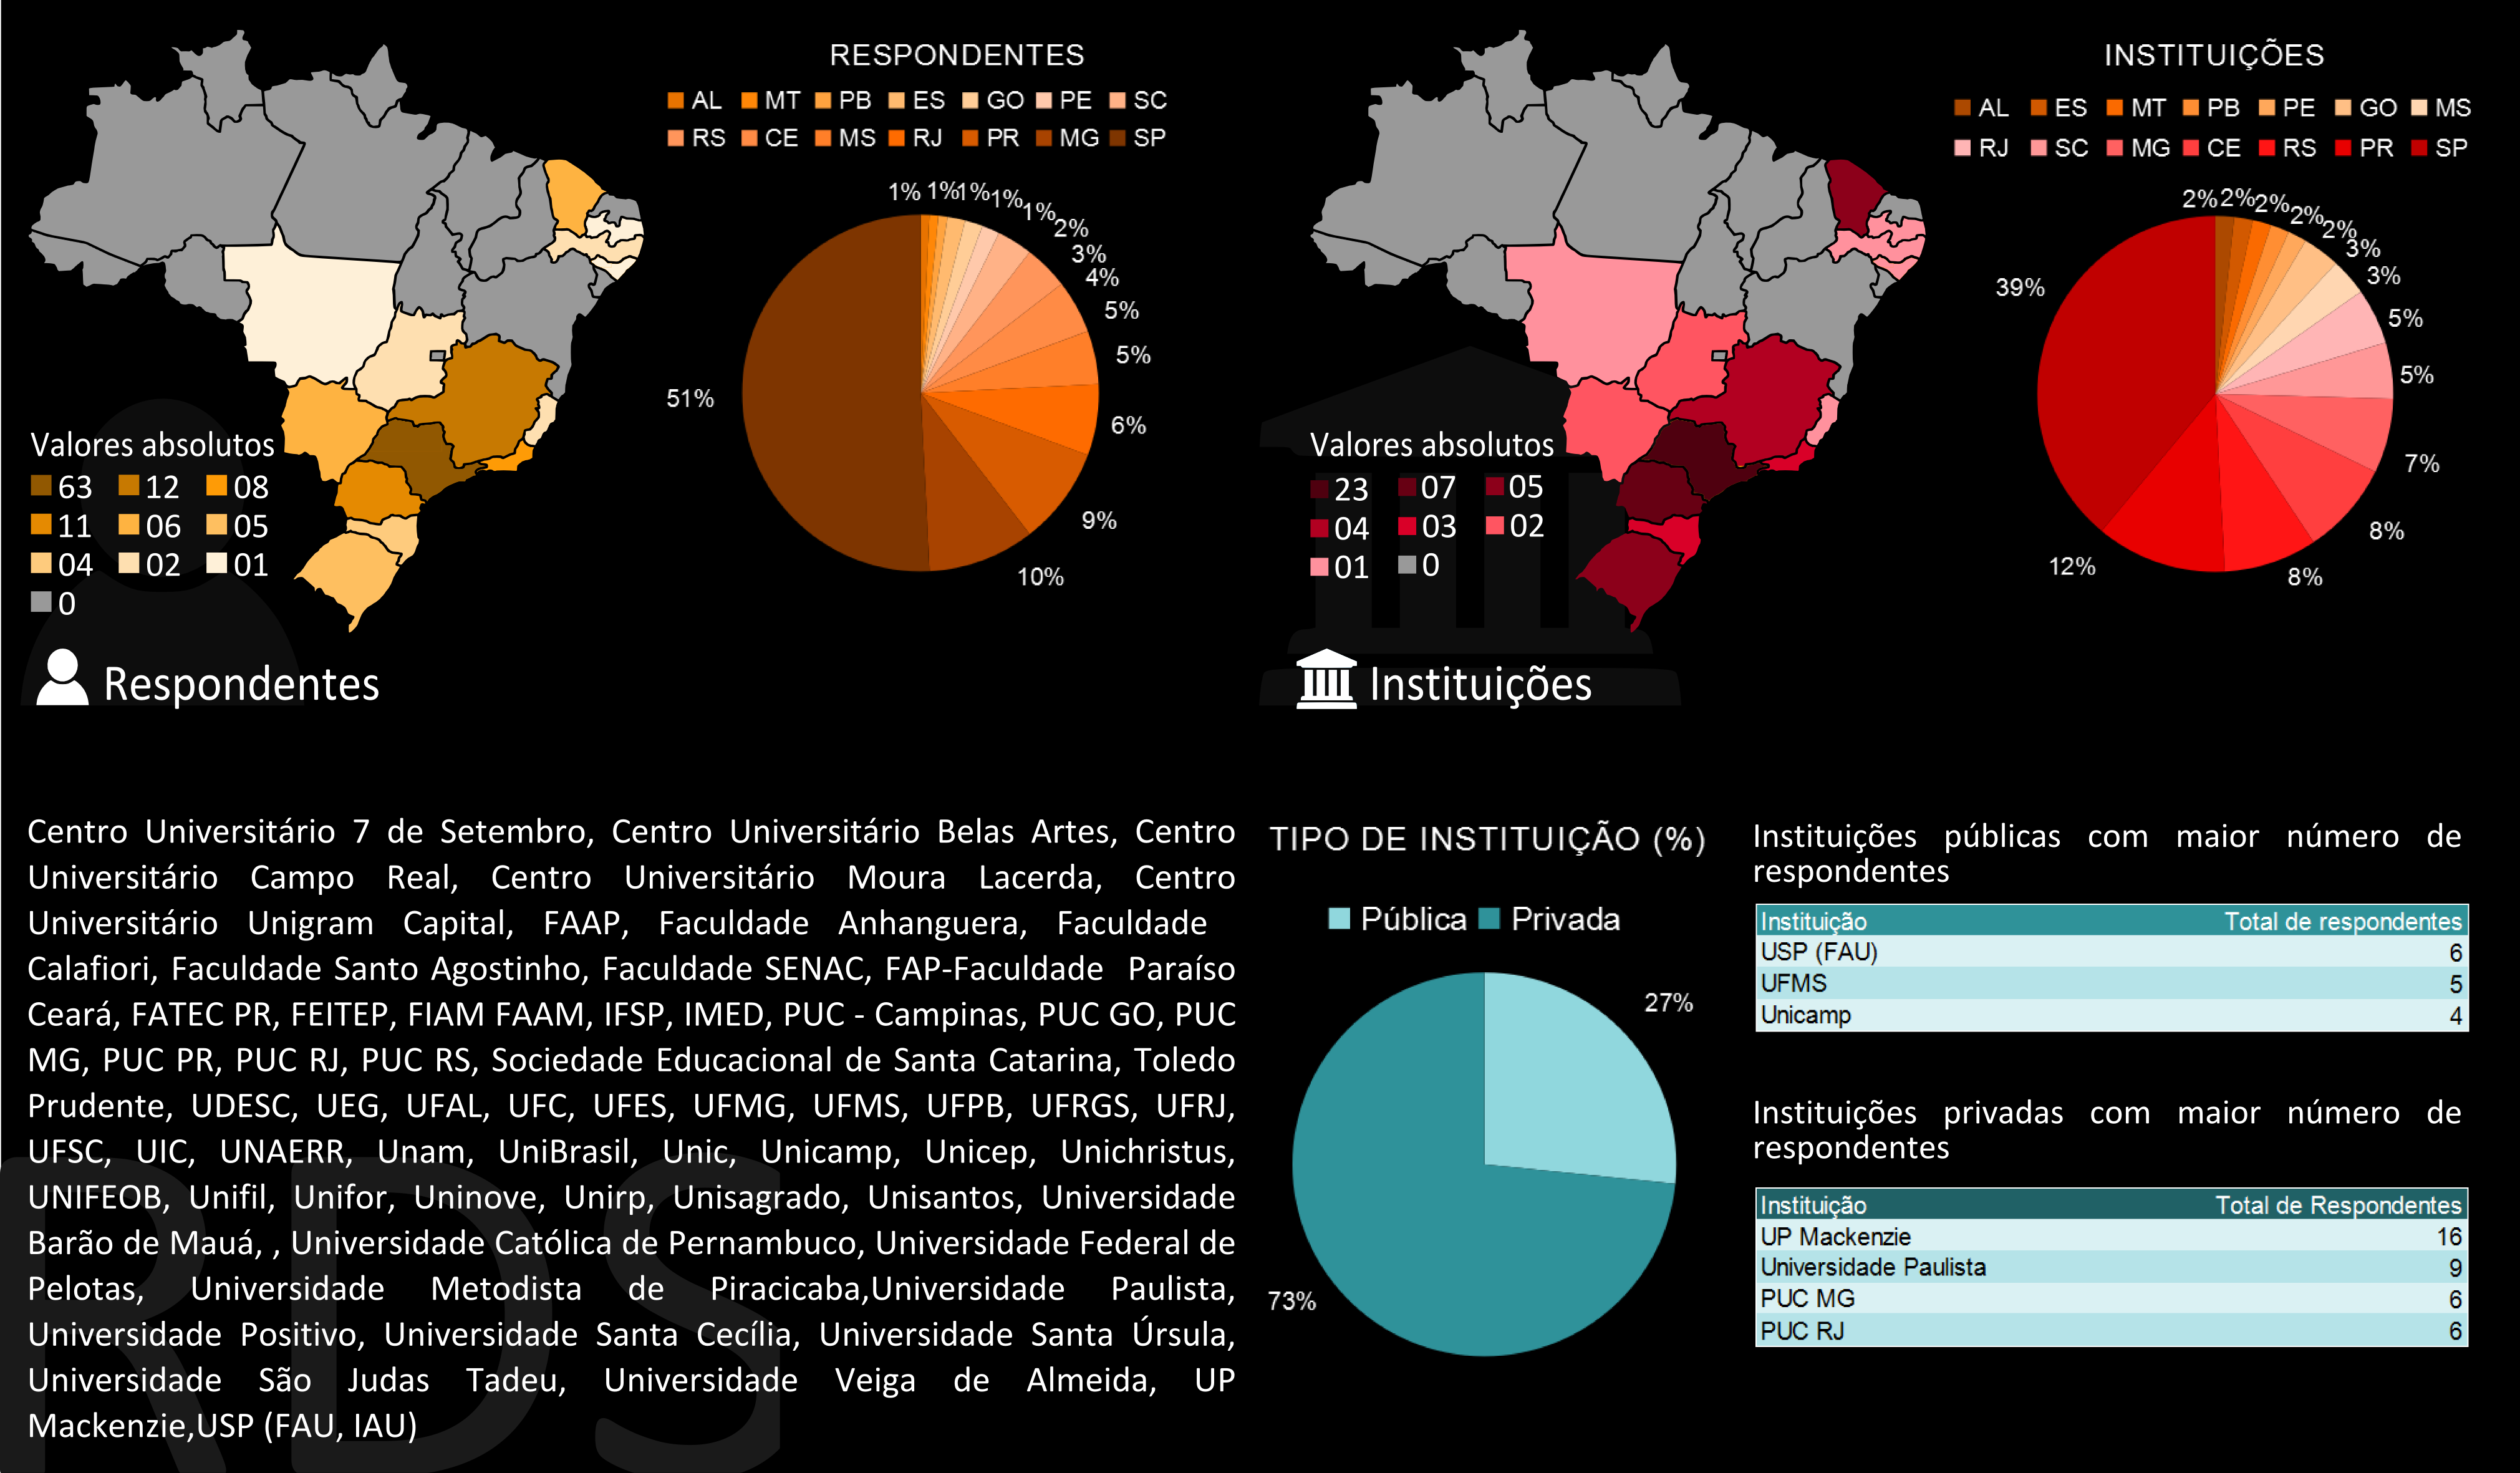
Fig. 2: Distribuição dos respondentes por estado brasileiro, por tipo de instituição pública ou privada, e listagem das instituições que tiveram respondentes. Fonte: Autores, 2020.
5 Respostas
Este item apresenta os gráficos resultantes das respostas ao questionário da pesquisa. Apresentamos as perguntas e destacamos, no texto, as opções de resposta indicadas por, pelo menos, metade dos respondentes. Nas perguntas que propõem uma gradação para expressar o grau de concordância, destacamos tanto as opções com maior quantidade de respondentes, quanto aquelas com menor quantidade.
5.1 Sobre a caracterização das atividades realizadas
Para a pergunta: Qual a escala e abrangência do(s) exercício(s) desenvolvido(s) com os alunos na disciplina? Os respondentes deveriam indicar através das opções Sim ou Não se foram contempladas as seguintes categorias de escala: Arquitetura (projeto de edificações); Projeto Urbano (desenho de fragmento urbano); Planejamento Urbano (planejamento territorial); Paisagismo (projeto de espaços abertos).
Os respondentes podiam indicar mais de uma categoria, de maneira que as opções Arquitetura (projeto de edificações) e Projeto Urbano (desenho de fragmento urbano) foram indicadas como Sim por mais da metade dos respondentes, sendo indicadas por 75,8% e 60,9%, respectivamente. A figura 3 apresenta o gráfico com as porcentagens de todas as categorias.
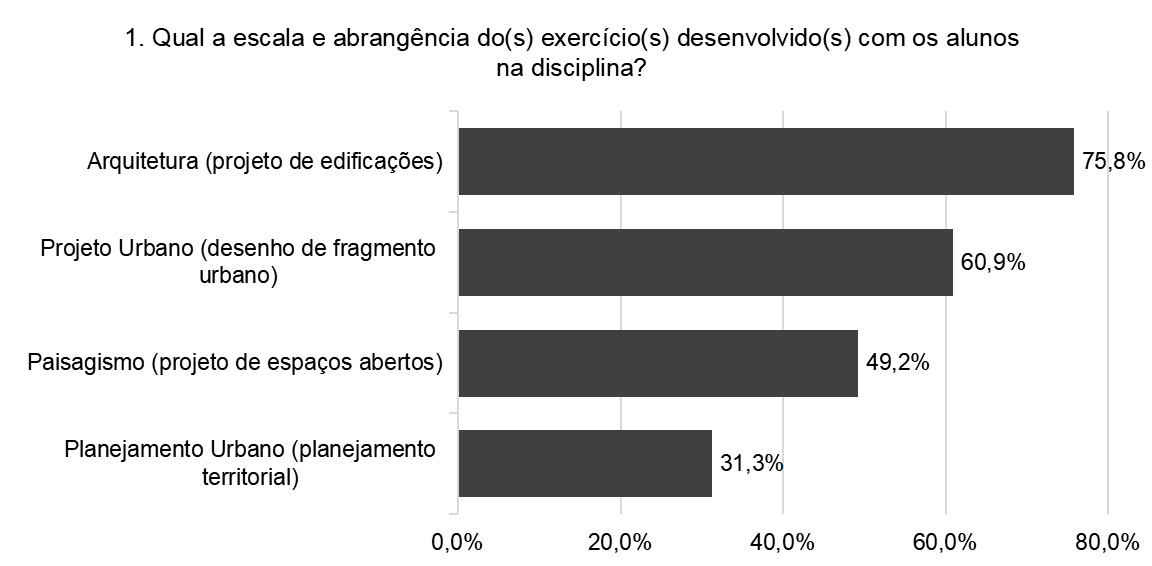
Fig. 3: Gráfico com a porcentagem dos respondentes que indicaram a opção Sim em cada uma das categorias apresentadas para a escala e abrangência dos exercícios propostos. Fonte: Autores, 2020.
Para a pergunta: Qual a natureza das atividades realizadas? Os respondentes deveriam indicar através das opções Sim ou Não se foram contempladas as seguintes categorias de escala: Arquitetura (projeto de edificações); Projeto Urbano (desenho de fragmento urbano); Planejamento Urbano (planejamento territorial); Paisagismo (projeto de espaços abertos).
Todas as categorias propostas foram indicadas como Sim por mais da metade dos respondentes, ficando com porcentagens entre 92,2%, na categoria Coleta e organização de informação como subsídio para projeto, e 64,1%, na categoria Modelagem digital de áreas urbanas ou edificações existentes. O gráfico com a porcentagem de respostas de todas as categorias propostas está representado na figura 4.

Fig. 4: Gráfico com a porcentagem dos respondentes que indicaram a opção Sim em cada uma das categorias de propostas para a natureza das atividades realizadas. Fonte: Autores, 2020.
5.2 Sobre os programas computacionais
Sobre os meios computacionais empregados, perguntou-se: Que programas computacionais foram utilizados na realização das atividades? Para respondê-la, foram oferecidas seis categorias de programas computacionais que permitem desenhos e modelagens de projetos arquitetônicos. Foram também propostas as categorias de Desenho à mão com instrumento, Desenho à mão sem instrumento, e Outros. Para cada uma dessas categorias, os respondentes deveriam indicar se elas foram utilizadas Principalmente, Complementarmente ou se Não foi Utilizado.
As categorias Programas Gráficos de desenho técnico e Programas Gráficos de modelagem foram as únicas indicadas como sendo utilizadas Principalmente por mais da metade dos respondentes. Nenhuma das categorias foi indicada como uso complementar por mais da metade dos respondentes, e a categoria Programas de modelagem paramétrica foi a única indicada como Não utilizada por mais da metade dos respondentes. A figura 5, a seguir, apresenta os números para todas as categorias:
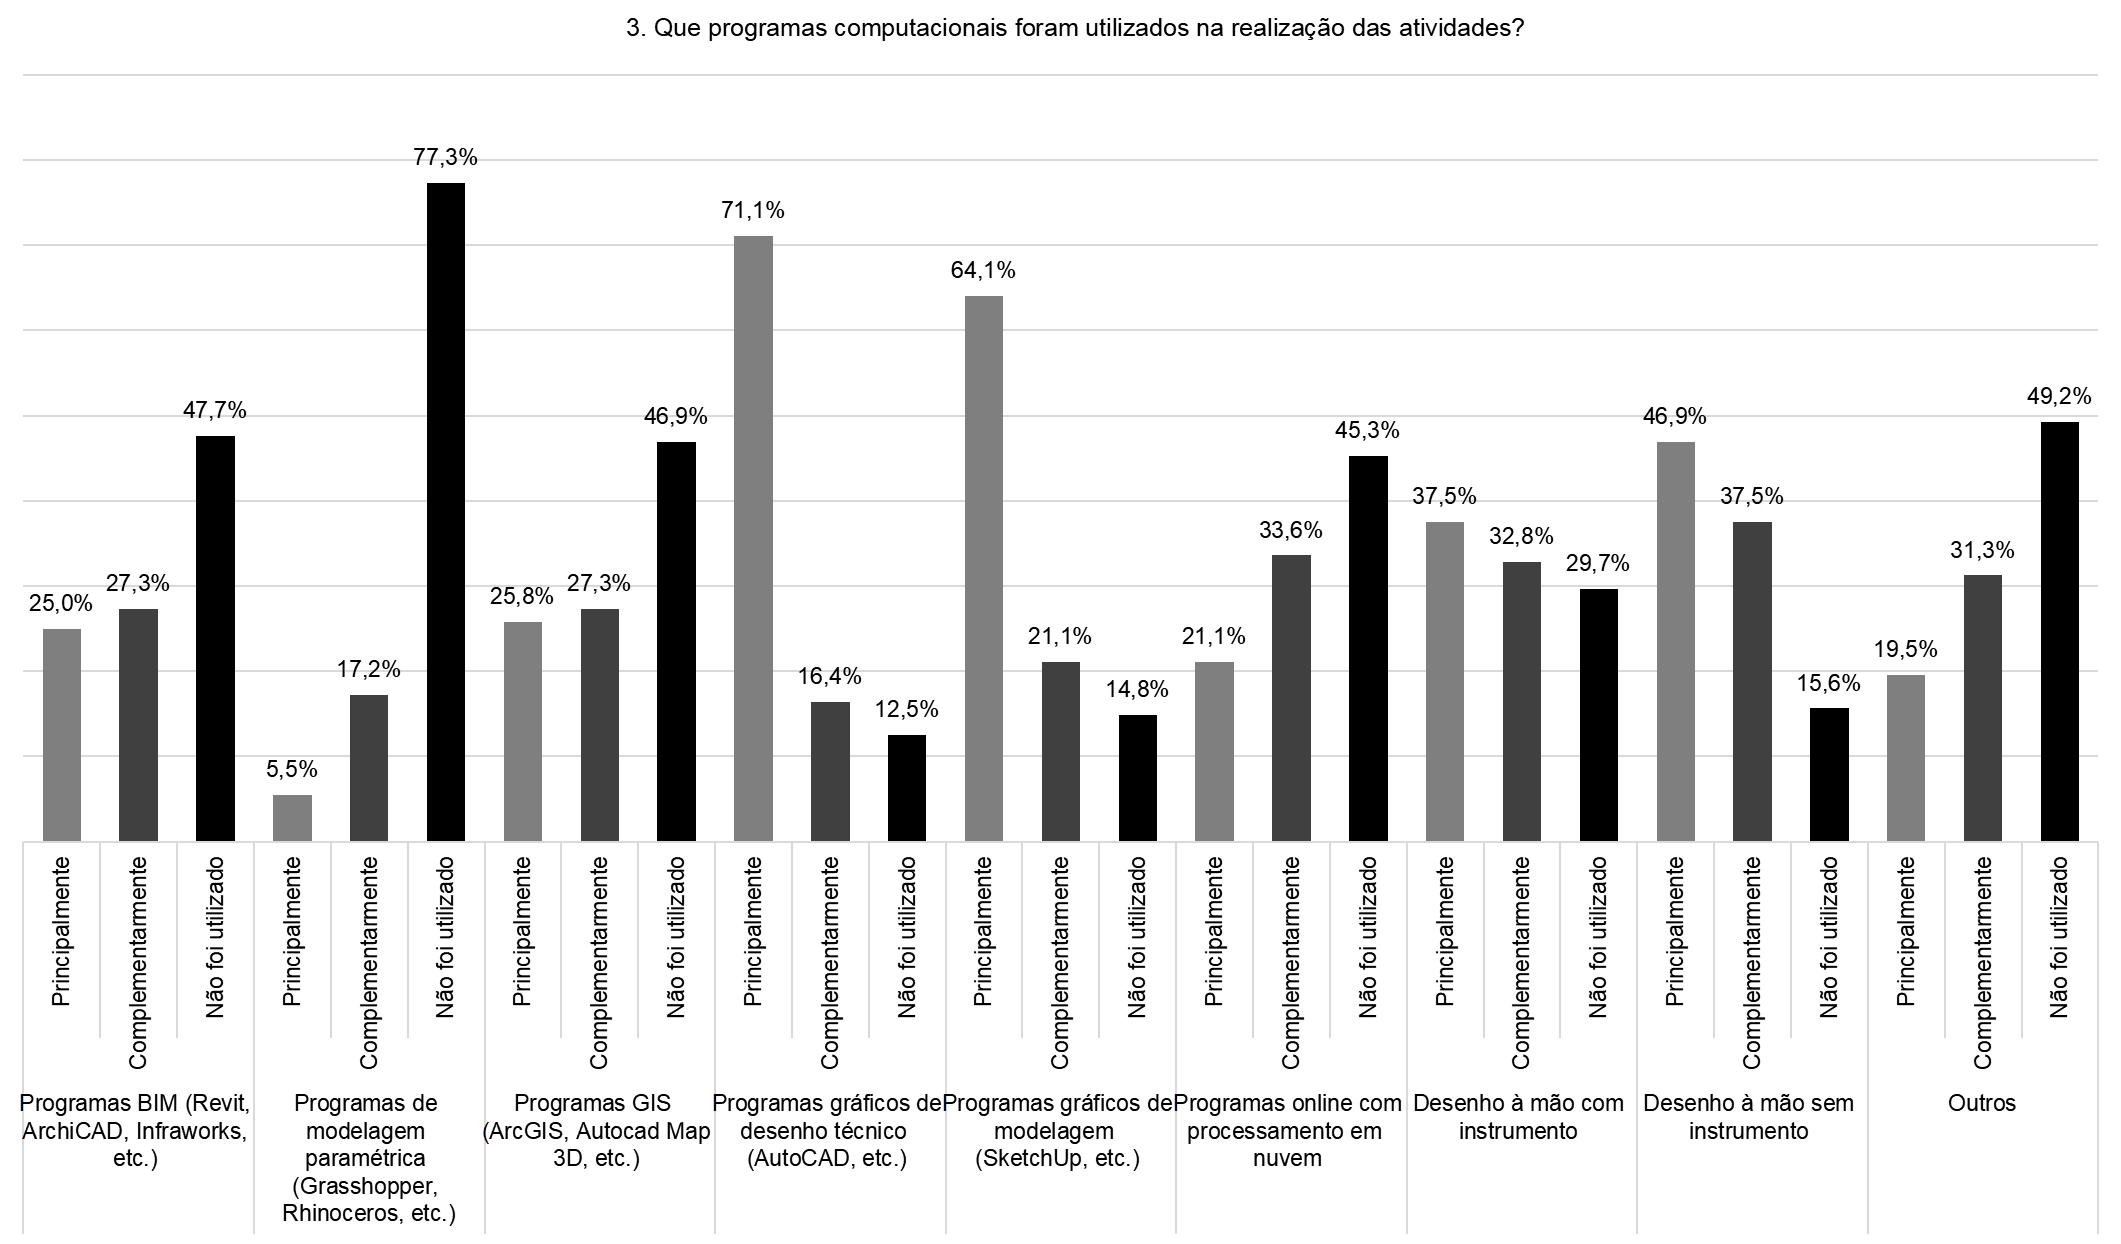
Fig. 5: Gráfico com a porcentagem dos respondentes que afirmaram utilizar Principalmente, Complementarmente ou Não utilizar diversos meios digitais, além da opção Outros para indicar o uso de meios não indicados nas alternativas do questionário. Fonte: Autores, 2020.
Em seguida, os entrevistados deveriam responder à pergunta: Quais aplicativos foram utilizados para a comunicação entre professores e alunos? Assim como na pergunta anterior, os respondentes tinham acesso a uma lista de aplicativos – além da opção Outros – e deveriam escolher dentre as opções Principalmente, Complementarmente ou Não utilizado, considerando um conjunto de aplicativos indicados.
Nenhum dos programas foi indicado por, pelo menos, a metade dos respondentes como tendo sido usado Principalmente. Entretanto as plataformas Google Meet e Zoom foram as que tiveram maiores indicações, sendo 43,8% e 43,0%, respectivamente. Com a opção Uso complementar, novamente nenhum dos aplicativos foi indicado por mais da metade dos respondentes. A opção Não utilizado foi marcada por mais da metade dos respondentes em oito das onze opções indicadas. As porcentagens podem ser consultadas no gráfico da figura 6.
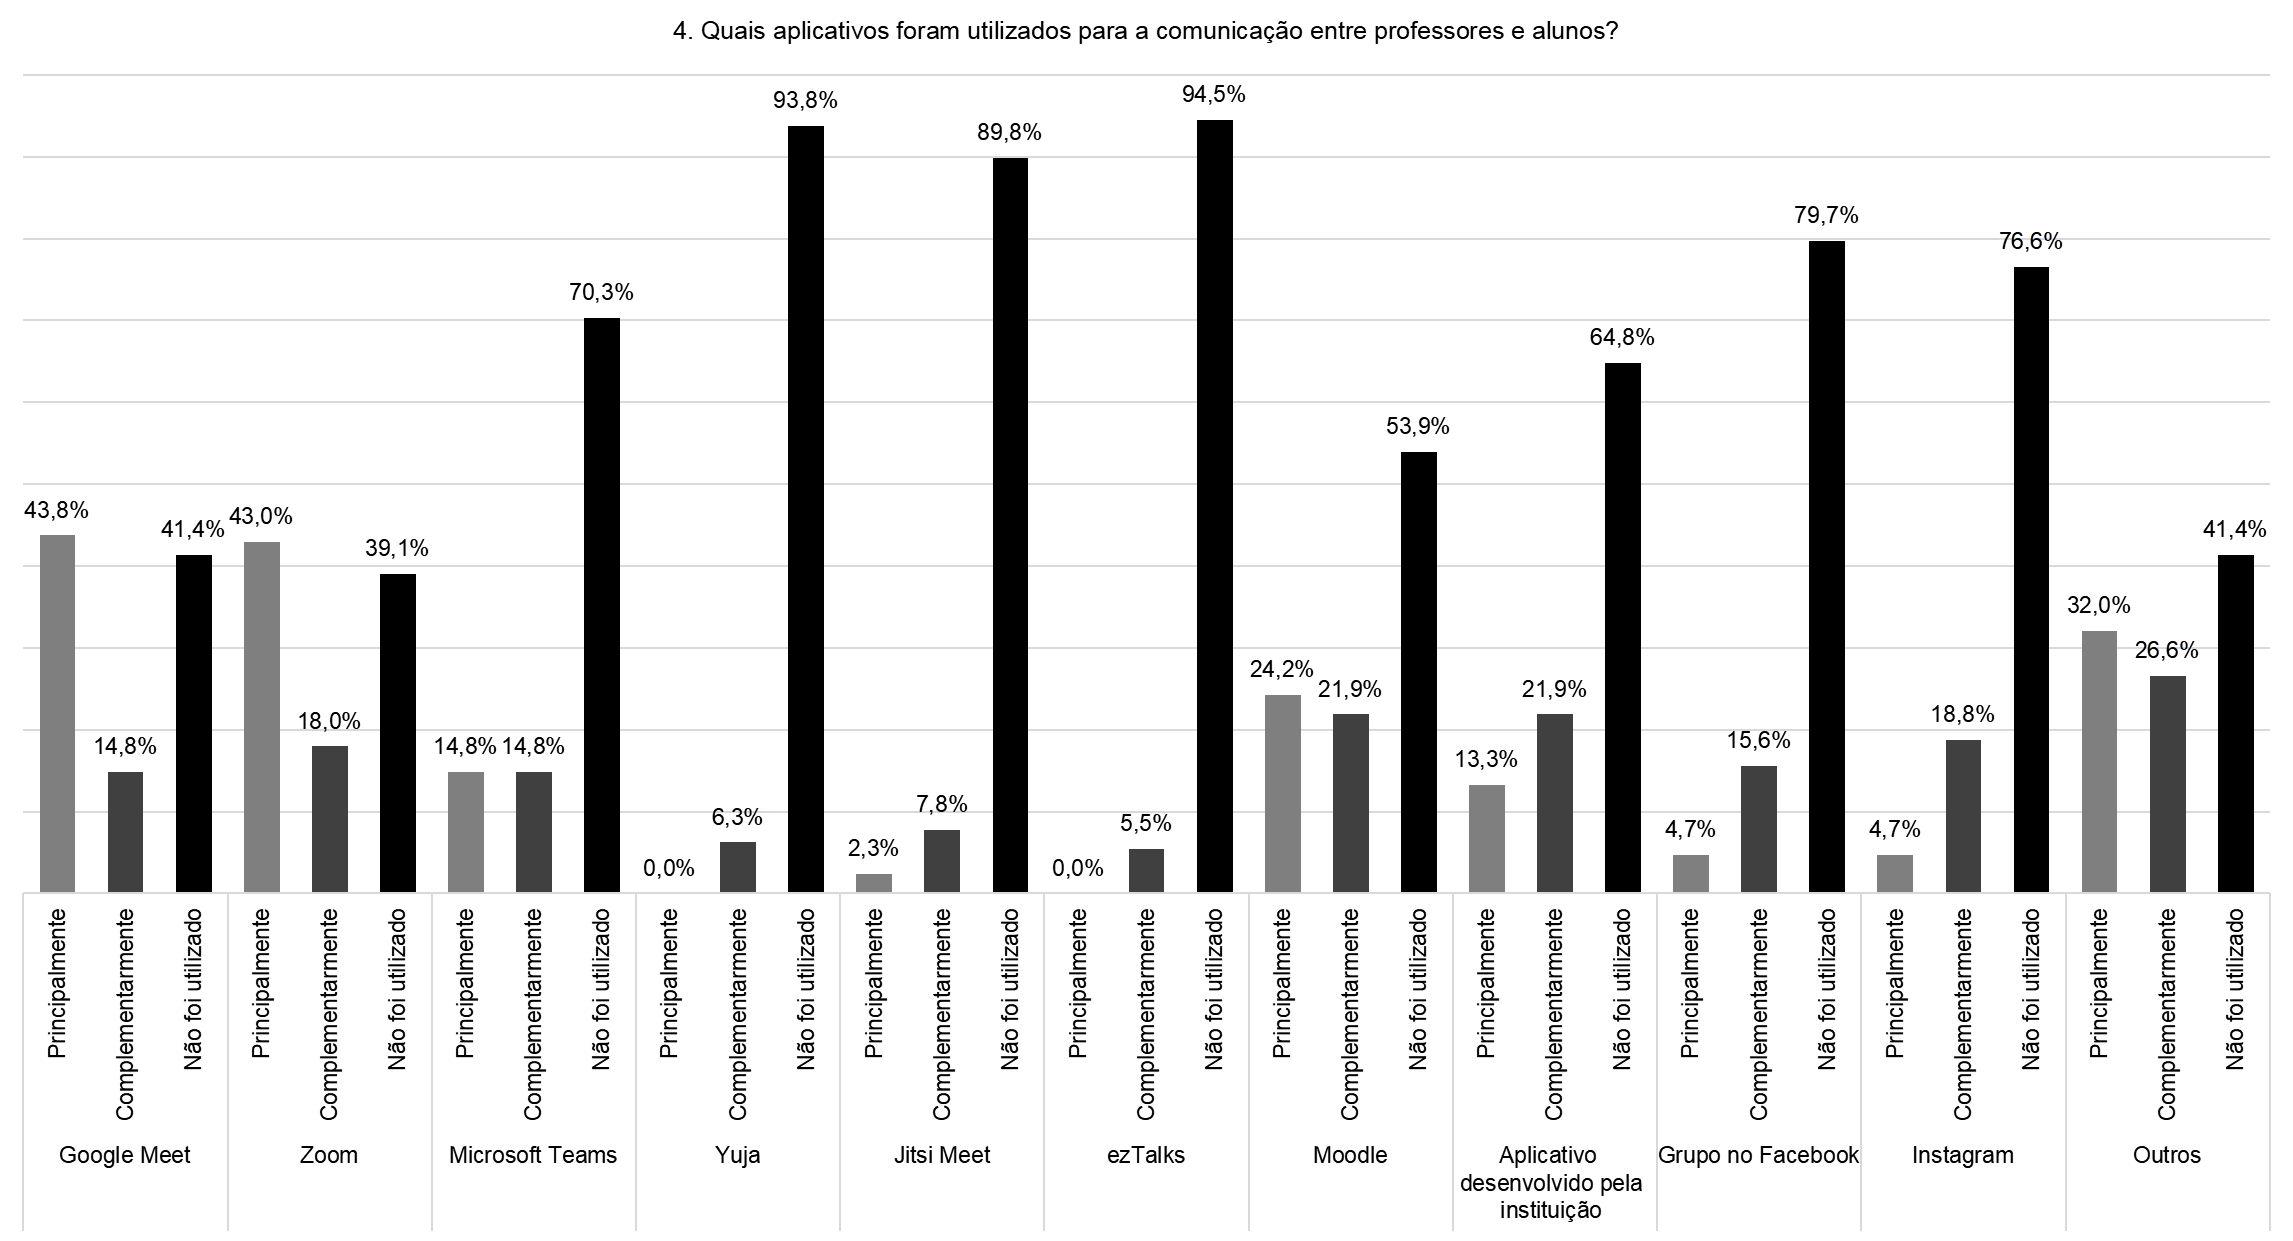
Fig. 6: Gráfico com a porcentagem dos respondentes que afirmaram utilizar Principalmente, Complementarmente ou Não utilizar os aplicativos considerados, além da opção Outros. Fonte: Autores, 2020.
5.3 Sobre as dinâmicas das disciplinas
Com relação à dinâmica das disciplinas, houve inicialmente duas perguntas: 1) Os exercícios da disciplina ONLINE foram individuais ou em grupo? e 2) Os exercícios da disciplina PRESENCIAL costumam ser individuais ou em grupo?. Para cada uma dessas perguntas, os respondentes deveriam indicar se os exercícios foram realizados Individualmente, em Duplas ou Em grupos.
Embora as porcentagens sejam distintas nas disciplinas presencial e online, nos dois casos a maior parte dos respondentes indicou que os exercícios ocorreram em grupo (54% na modalidade presencial e 45% na modalidade online), seguido pela porcentagem de exercícios individuais (34% na modalidade presencial e 41% na modalidade online) e, por fim, exercícios em duplas (12% na modalidade presencial e 14% na modalidade online). A figura 7 apresenta os gráficos com as respostas.
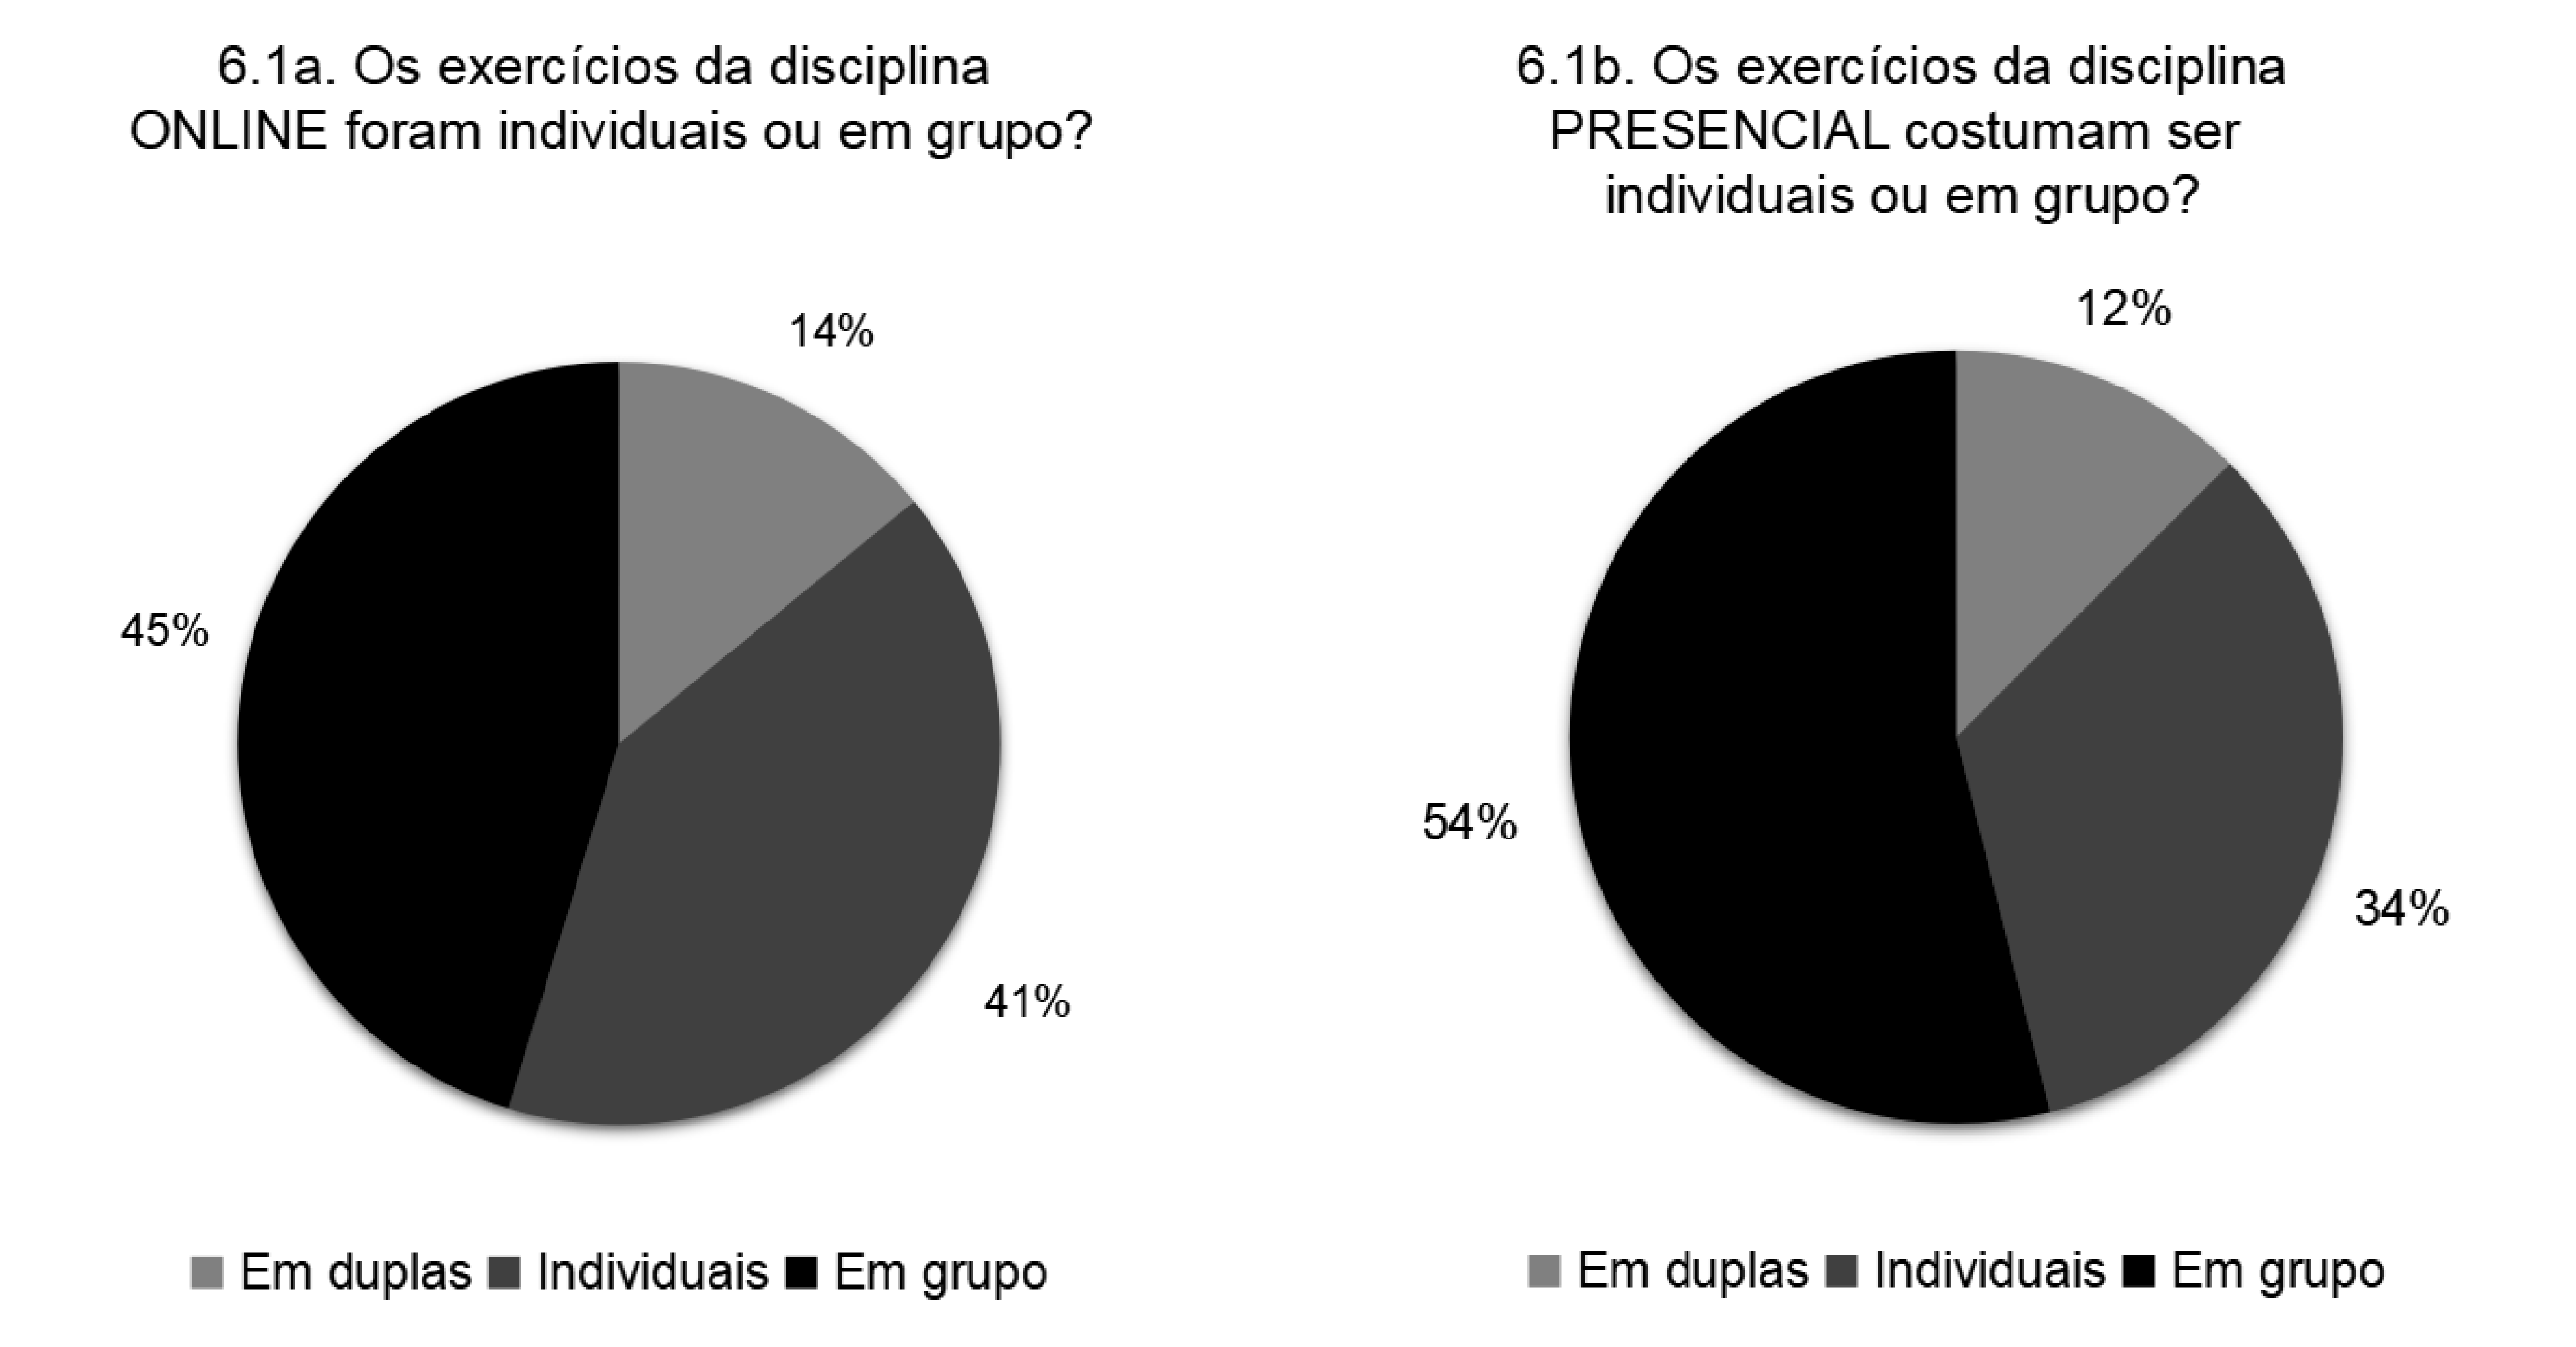
Fig. 7: Gráficos com as porcentagens indicando o número de alunos nas atividades realizadas nas modalidades online e presencial. Fonte: Autores, 2020.
Especificamente sobre a disciplina online, perguntou-se: Quantos alunos há na turma? Os respondentes deveriam escolher entre intervalos conforme explicitado na legenda do gráfico da figura 8. A maioria dos respondentes (56%) indicou que sua turma tinha 30 alunos ou menos, seguidos por 32% que indicaram turmas entre 31 e 50 alunos. O restante soma 6% de respondentes que indicaram haver entre 51 e 70 alunos e outros 6% que indicaram terem trabalhado com turmas com mais de 100 alunos, outras opções não receberam nenhuma menção. O gráfico correspondente está na imagem da figura 8 abaixo.
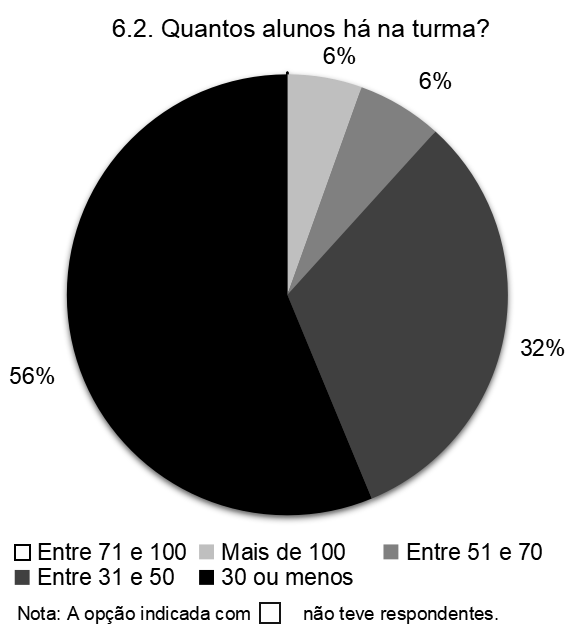
Fig. 8: Gráfico com as porcentagens indicando o número de alunos das turmas durante as atividades remotas. Fonte: Autores, 2020.
Sobre a duração dos exercícios, foi perguntado: Qual a duração total do exercício proposto, em semanas? Nenhuma das opções foi indicada por, pelo menos, metade dos respondentes. Entretanto, dentre as 9 opções apresentadas conforme a legenda do gráfico da figura 9, a soma das 3 primeiras opções com maior número de respondentes ultrapassa a marca dos 50%. As opções com maior número de respondentes foram 4 a 5 semanas (21%), menos de 4 semanas (20%) e 15 a 16 semanas (16%).
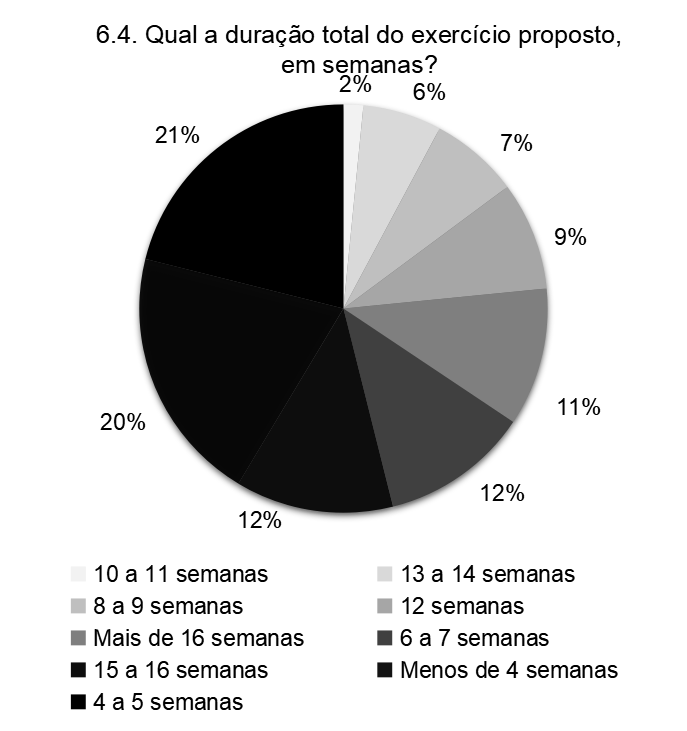
Fig. 9: Gráfico com as porcentagens de respondentes para o tempo de duração dos exercícios propostos. Fonte: Autores, 2020.
Com relação à frequência dos atendimentos foi feita a pergunta: Com que frequência cada aluno/grupo teve/tem atendimento com o(s) professor(es)? Para esta pergunta, a opção Semanal foi escolhida por 87% dos respondentes, e o restante foi distribuído entre as demais opções, conforme mostra o gráfico da figura 10.

Fig. 10: Gráfico com as porcentagens de respondentes para o tempo de duração dos exercícios propostos. Fonte: Autores, 2020.
Com relação à duração de cada atendimento foi perguntado: Em geral, quanto tempo durou/dura cada atendimento? A opção Menos de 30 minutos foi indicada por 52% dos respondentes, seguida por 29%, que indicaram que os atendimentos duraram entre 30 e 45 minutos, e por 8%, que indicaram que os atendimentos duraram mais de 120 minutos. As porcentagens de todas as opções estão indicadas no gráfico da figura 11.

Fig. 11: Gráfico com as porcentagens de respondentes para o tempo de duração dos atendimentos. Fonte: Autores, 2020.
5.4 Sobre os alunos e seus recursos
Este conjunto de perguntas levantou dados sobre a participação dos alunos nas atividades propostas. Buscava-se saber se as Instituições realizaram enquetes para conhecer a realidade dos alunos em seu ambiente doméstico, qual a postura dos alunos frente às atividades propostas, e como os entrevistados classificavam os recursos que os alunos dispunham para a realização das atividades.
Sobre a realização de enquetes com os alunos, foi feita a seguinte pergunta: Foi realizada uma enquete com os alunos para mapear suas condições de trabalho à distância? Os respondentes deveriam optar entre Sim ou Não, de modo que 58% indicaram a resposta Não e 42% indicaram a resposta Sim, conforme apresentado no gráfico da figura 12.

Fig. 12: Gráfico com as porcentagens de Sim e Não dos respondentes para a pergunta sobre a realização de enquete com os alunos. Fonte: Autores, 2020.
Na sequência, foi feita a seguinte pergunta: Se sim, seria possível termos acesso às perguntas e resultados? Neste caso, 80% dos respondentes indicaram Não como resposta e 20% indicaram Sim, conforme apresentado no gráfico da figura 13.

Fig. 13: Gráfico com as porcentagens de Sim e Não dos respondentes para a pergunta sobre dar acesso aos pesquisadores aos resultados da enquete com os alunos, se ela existir. Fonte: Autores, 2020.
Sobre a impressão dos respondentes em relação à postura dos alunos frente às atividades propostas, foi feita a seguinte pergunta: Houve resistência da parte dos alunos às novas atividades propostas? Neste caso, 70% dos respondentes indicaram a opção Não e 30% indicaram Sim, conforme apresentado no gráfico da figura 14.

Fig. 14: Gráfico com as porcentagens de Sim e Não dos respondentes sobre alguma resistência da parte dos alunos às novas atividades propostas. Fonte: Autores, 2020.
Sobre a influência da resistência nas atividades propostas, foi feita a seguinte pergunta: Essa resistência impediu/retardou/dificultou a realização das atividades? Neste caso, 81% do total dos respondentes indicaram Não e 19% indicaram Sim, conforme apresentado no gráfico da figura 15.

Fig. 15: Gráfico com as porcentagens de Sim e Não dos respondentes para a pergunta sobre influência da resistência nas novas atividades propostas. Fonte: Autores, 2020.
Sobre a dedicação dos alunos nas atividades remotas, foi feita a seguinte pergunta: A dedicação dos alunos foi maior do que na disciplina presencial? Para esta pergunta, 55% dos respondentes indicaram a resposta Não e 45% indicaram a resposta Sim. Conforme apresentado no gráfico da figura 16.

Fig. 16: Gráfico com as porcentagens de Sim e Não dos respondentes para a pergunta sobre a dedicação dos alunos disciplina presencial. Fonte: Autores, 2020.
Sobre os recursos que os alunos dispunham para a realização das atividades remotas foi feita a pergunta: A maioria dos alunos dispunha de computador adequado? Para a qual, 79% dos respondentes indicaram a resposta Sim, enquanto 21% indicou a resposta Não, conforme o gráfico da figura 17.
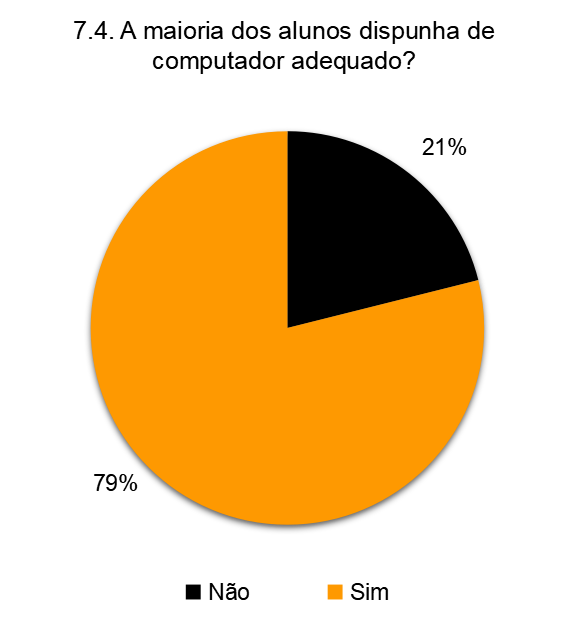
Fig. 17: Gráfico com as porcentagens de respostas Sim e Não para a pergunta sobre a maioria dos alunos dispor de computador adequado. Fonte: Autores, 2020.
Ainda sobre os recursos que os alunos dispunham, foi feita a pergunta: A maioria dos alunos dispunha de conexão à Internet adequada? Para esta pergunta, 75% dos respondentes indicaram a resposta Sim, enquanto 25% indicou a resposta Não, conforme o gráfico da figura 18.
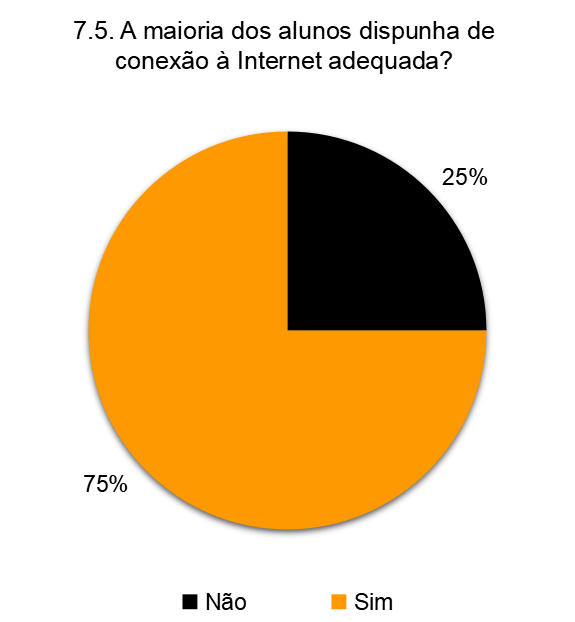
Fig. 18: Gráfico com as porcentagens de respostas Sim e Não para a pergunta sobre a maioria dos alunos dispor de conexão adequada à Internet. Fonte: Autores, 2020.
Por fim, sobre o ambiente doméstico dos alunos, foi feita a pergunta: A maioria dos alunos dispunha de condições adequadas no ambiente doméstico? Para esta pergunta, 76% dos respondentes indicaram a resposta Sim, enquanto 24% indicou a resposta Não, conforme indicado no gráfico da figura 19.
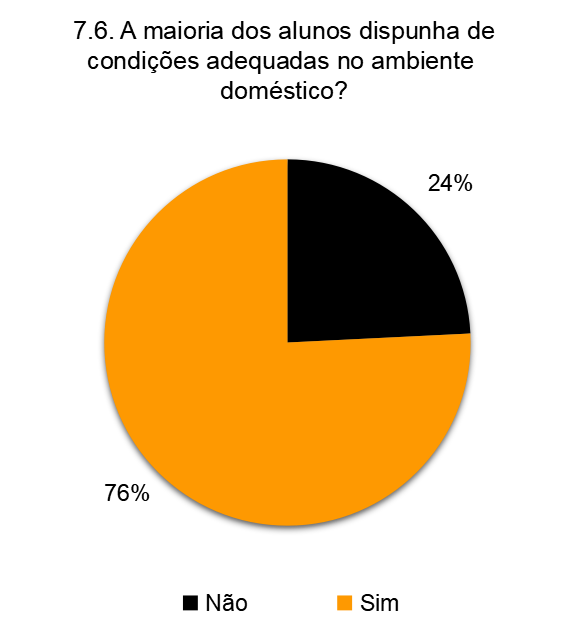
Fig. 19: Gráfico com as porcentagens de respostas Sim e Não para a pergunta sobre as condições no ambiente doméstico dos alunos. Fonte: Autores, 2020.
5.5 Avaliações preliminares
Por fim, foi proposto um bloco de perguntas para que os respondentes elaborassem uma avaliação preliminar das atividades propostas. Foram apresentadas afirmações para as quais os respondentes deveriam indicar o seu grau de concordância segundo a escala Concordo plenamente, Concordo parcialmente, Tendo a discordar e Discordo totalmente.
Diante da afirmação: A escala e abrangência do exercício revelaram-se adequadas à atividade online, a opção mais indicada pelos respondentes foi Concordo parcialmente, com 55% das indicações. Por outro lado, a opção com menor porcentagem de respostas foi Discordo totalmente, com 2% das indicações. O gráfico com as porcentagens está representado na figura 20.
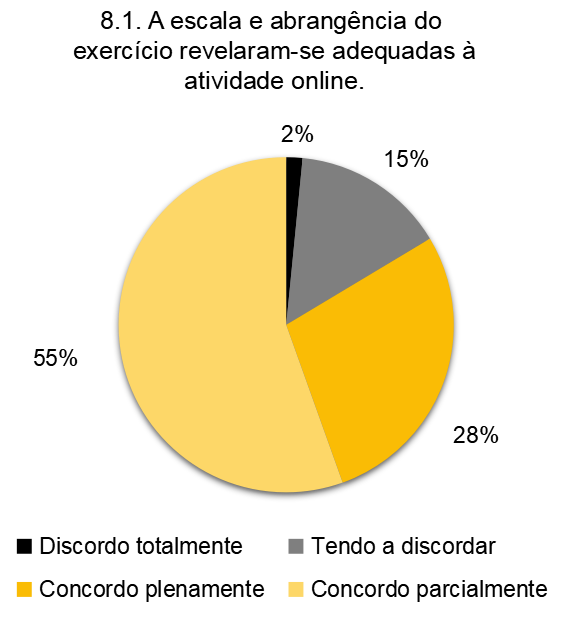
Fig. 20: Gráfico com as porcentagens de respostas da avaliação preliminar para a afirmação: A escala e abrangência do exercício revelaram-se adequadas à atividade online. Fonte: Autores, 2020.
Sobre a afirmação: Os programas computacionais para desenvolvimento de projeto foram facilmente utilizados pelos alunos, nenhuma das opções foi indicada por, pelo menos, metade dos respondentes, porém as duas opções com maior porcentagem totalizaram 79% dos respondentes, sendo que Concordo parcialmente correspondeu a 45% dos respondentes e Concordo plenamente correspondeu a 34%. A opção com menor número de menções foi Discordo totalmente, por 6% dos respondentes. A distribuição de todas as opções está representada no gráfico da figura 21.
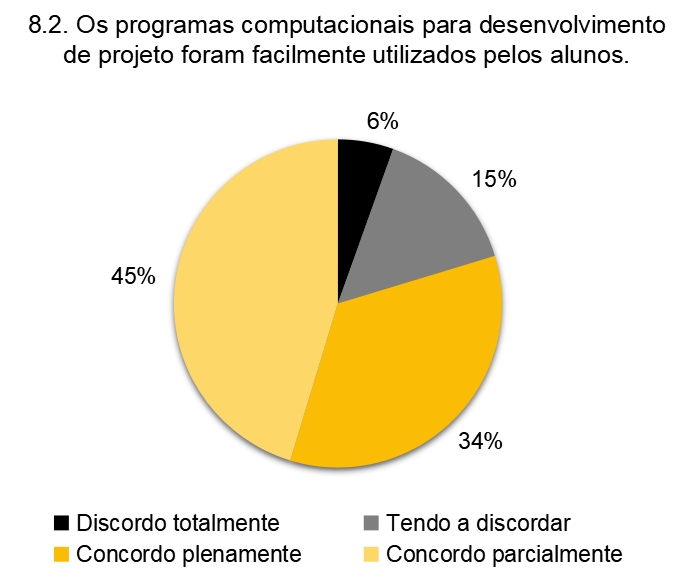
Fig. 21: Gráfico com as porcentagens de respostas da avaliação preliminar para a afirmação: Os programas computacionais para desenvolvimento de projeto foram facilmente utilizados pelos alunos. Fonte: Autores, 2020.
Sobre a afirmação: As sessões com comunicação síncrona com os alunos foram proveitosas, 56% dos respondentes indicaram a opção Concordo plenamente para a afirmação. A opção com menos respondentes foi Discordo totalmente, indicada por 3%. No gráfico da figura 22, está a porcentagem de cada uma das opções.
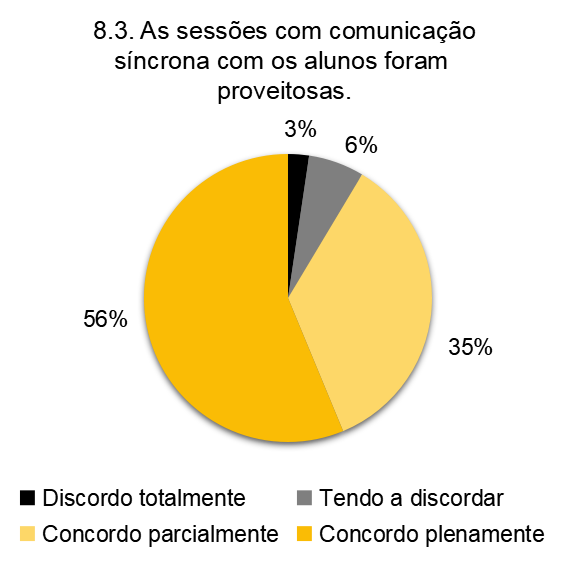
Fig. 22: Gráfico com as porcentagens de respostas da avaliação preliminar para a afirmação: As sessões com comunicação síncrona com os alunos foram proveitosas. Fonte: Autores, 2020.
Sobre a afirmação: Os objetivos das atividades propostas foram atingidos, nenhuma das opções foi indicada por metade dos respondentes, porém as opções Concordo plenamente e Concordo parcialmente somaram 94% das indicações, apresentando, respectivamente, as porcentagens 48% e 46%. Neste caso, a opção com menor número de respondentes foi Discordo totalmente, sendo indicada por 1% dos respondentes. o gráfico completo com as porcentagens está representado na figura 23.
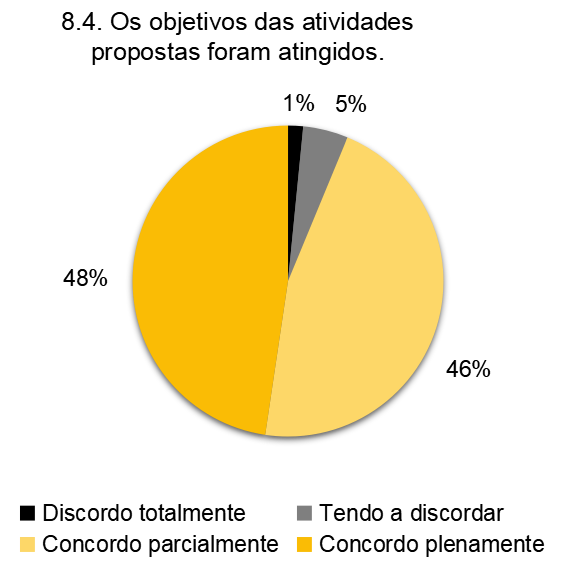
Fig. 23: Gráfico com as porcentagens de respostas da avaliação preliminar para a afirmação Os objetivos das atividades propostas foram atingidos. Fonte: Autores, 2020.
Sobre a afirmação: Houve muitas perdas em relação à disciplina presencial, a alternativa que teve mais respondentes foi Concordo parcialmente, indicada por 53% dos respondentes. Por outro lado, a alternativa com menos respondentes foi Discordo totalmente, indicada por 6% dos respondentes. O gráfico completo referente a esta afirmação está representado na figura 24.
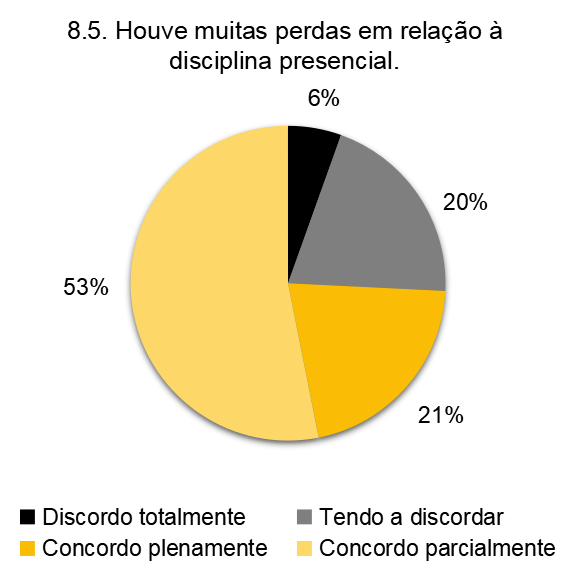
Fig. 24: Gráfico referente à afirmação Houve muitas perdas em relação à disciplina presencial. Fonte: Os autores.
Sobre a afirmação: Houve muitos ganhos em relação à disciplina presencial, a alternativa que teve mais respondentes foi Concordo parcialmente, indicada por 50% dos respondentes, por outro lado, a alternativa com menos respondentes foi Concordo plenamente, indicada por 3% dos respondentes. O gráfico completo referente a esta afirmação está representado na figura 25.
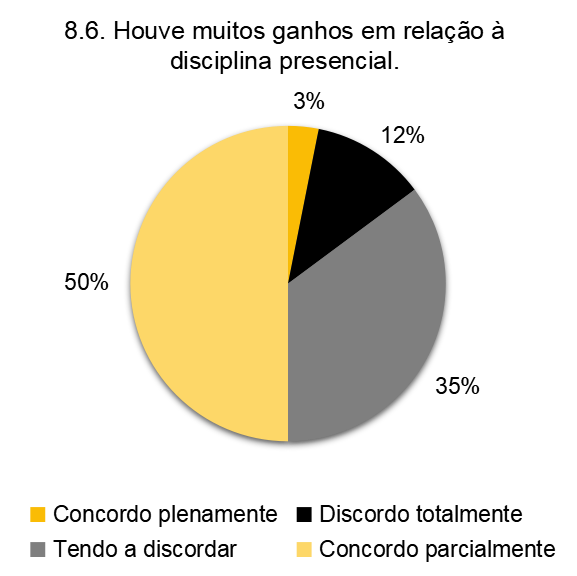
Fig. 25: Gráfico com as porcentagens de respostas da avaliação preliminar para a afirmação Houve muitos ganhos em relação à disciplina presencial. Fonte: Autores, 2020.
Sobre a afirmação: A maioria dos alunos ficou satisfeita com os resultados das atividades, nenhuma opção foi indicada por, pelo menos, metade dos respondentes, porém as opções Concordo plenamente e Concordo parcialmente somam 86% dos respondentes. Separadamente, correspondem a 46% e 40% dos respondentes, respectivamente. A opção com menor porcentagem de respondentes foi Discordo totalmente, com 2%. O gráfico completo referente a esta afirmação está representado na figura 26.
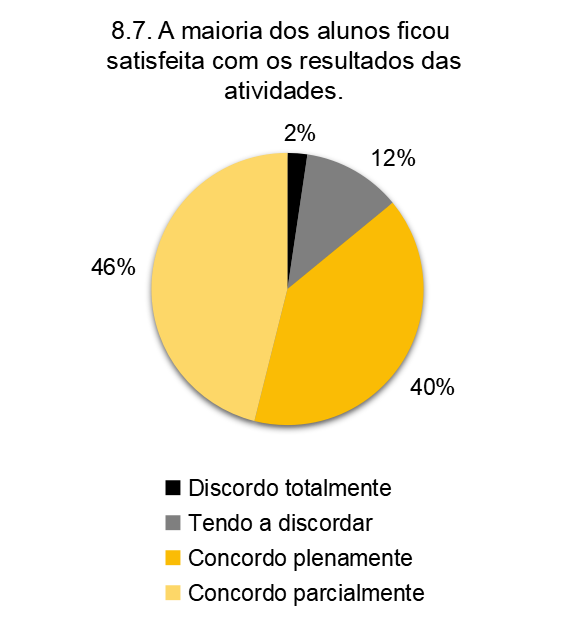
Fig. 26: Gráfico com as porcentagens de respostas da avaliação preliminar para a afirmação A maioria dos alunos ficou satisfeita com os resultados das atividades. Fonte: Autores, 2020.
Sobre a afirmação: Os professores ficaram satisfeitos com os resultados das atividades, nenhuma das opções foi indicada por, pelo menos, metade dos respondentes. Porém, as opções Concordo plenamente e Concordo parcialmente somam 80% dos respondentes, separadamente correspondem a 48% e 32%, respectivamente. A opção com menor porcentagem de respondentes foi Discordo totalmente, com 4%. O gráfico completo referente a esta afirmação está representado na figura 27.
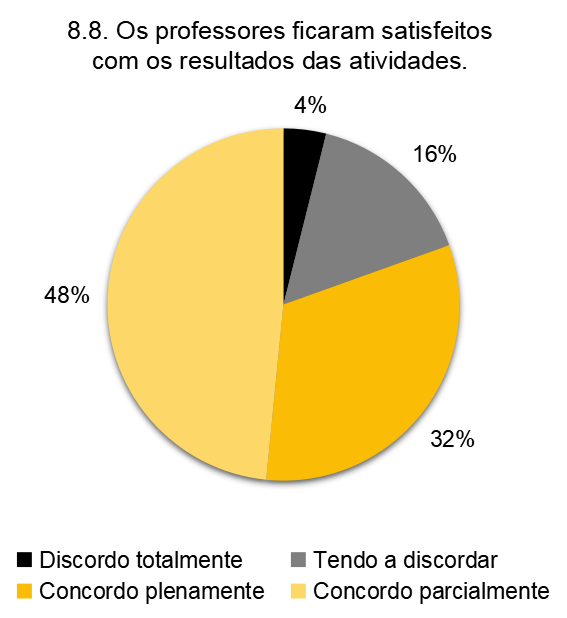
Fig. 27: Gráfico com as porcentagens de respostas da avaliação preliminar para a afirmação Os professores ficaram satisfeitos com os resultados das atividades. Fonte: Autores, 2020.
Sobre a afirmação: As peças gráficas produzidas são de boa qualidade, nenhuma das opções foram indicadas por pelo menos metade dos respondentes, porém as opções, Concordo plenamente e Concordo parcialmente somam 84% dos respondentes, separadamente correspondem a 47% e 37%, respectivamente. A opção com menor porcentagem de respondentes foi Discordo totalmente, com 1%. O gráfico completo referente a esta afirmação está representado na figura 28.
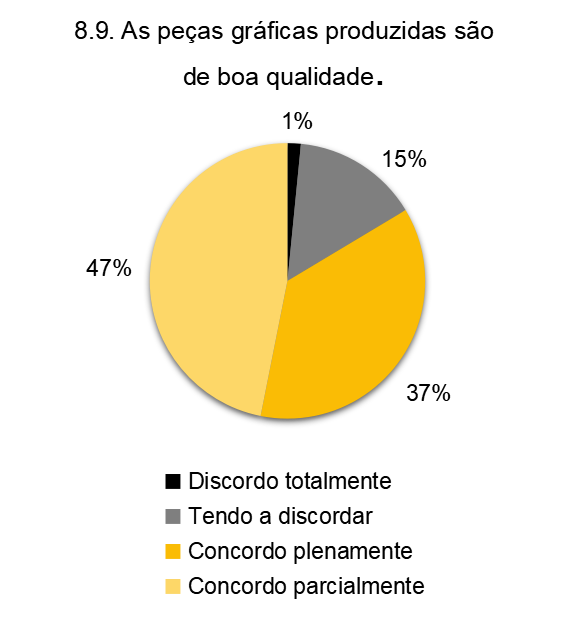
Fig. 28: Gráfico com as porcentagens de respostas da avaliação preliminar para a afirmação As peças gráficas produzidas são de boa qualidade. Fonte: Autores, 2020.
Sobre a afirmação: As peças gráficas foram produzidas em quantidade suficiente, nenhuma das opções foram indicadas por pelo menos metade dos respondentes, porém as opções, Concordo plenamente e Concordo parcialmente somam 81% dos respondentes, separadamente correspondem a 43% e 38%, respectivamente. A opção com menor porcentagem de respondentes foi Discordo totalmente, com 4%. O gráfico completo referente a esta afirmação está representado na figura 29.
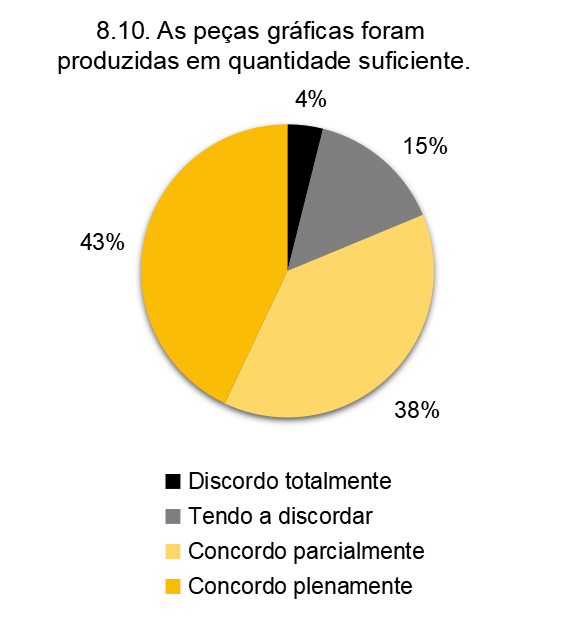
Fig. 29: Gráfico com as porcentagens de respostas da avaliação preliminar para a afirmação As peças gráficas foram produzidas em quantidade suficiente. Fonte: Autores, 2020.
Sobre a afirmação: A experiência revelou procedimentos online que poderiam ser incorporados às disciplinas presenciais, nenhuma das opções foram indicadas por pelo menos metade dos respondentes, porém as opções Concordo plenamente e Concordo parcialmente somam 81% dos respondentes, e separadamente correspondem a 43% e 38%, respectivamente. A opção com menor porcentagem de respondentes foi Discordo totalmente, com 1%. O gráfico completo referente a esta afirmação está representado na figura 30.
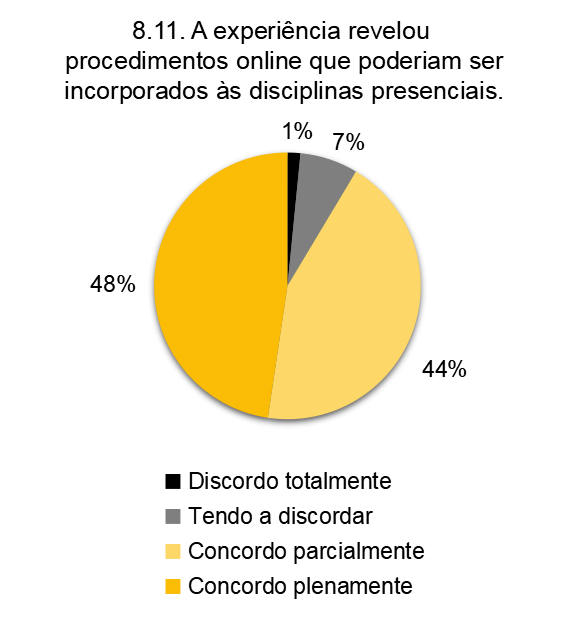
Fig. 30: Gráfico com as porcentagens de respostas da avaliação preliminar para a afirmação A experiência revelou procedimentos online que poderiam ser incorporados às disciplinas presenciais. Fonte: Autores, 2020.
Sobre a afirmação: A disciplina online demanda de todos os envolvidos procedimentos mais rígidos do que a disciplina presencial, nenhuma das opções foram indicadas por pelo menos metade dos respondentes, porém as opções, Concordo plenamente e Concordo parcialmente somam 80% dos respondentes, separadamente correspondem a 43% e 37%, respectivamente. A opção com menor porcentagem de respondentes foi Discordo totalmente, com 5%. O gráfico completo referente a esta afirmação está representado na figura 31.
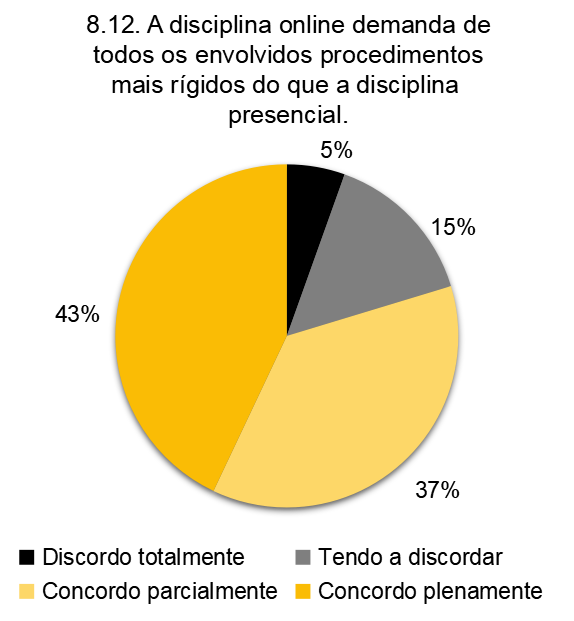
Fig. 31: Gráfico com as porcentagens de respostas da avaliação preliminar para a afirmação A disciplina online demanda de todos os envolvidos procedimentos mais rígidos do que a disciplina presencial. Fonte: Autores, 2020.
6 Levantamento e experimentações de aplicativos
Considerando as respostas às questões abertas dos respondentes vinculados tanto a instituições brasileiras quanto internacionais, e somando a informações de pesquisadores, do Nomads.usp e externos a ele, levantou-se um conjunto de aplicativos computacionais2 indicados como convenientes ao ensino remoto de projeto. A listagem desses aplicativos permite identificar um conjunto variado de programas com o potencial de responder a demandas como representação, modelagem e comunicação síncrona, ainda que nem sempre de maneira simultânea.
No contexto do projeto de arquitetura, e considerando o papel da representação, do modelo e, obviamente, das discussões coletivas no processo, foram selecionados aplicativos que passaram por uma fase exploratória conduzida pela equipe de pesquisadores. As explorações ocorreram individualmente, no caso de aplicativos sem a possibilidade de trabalho colaborativo, ou com outro(s) pesquisador(es) quando havia a possibilidade de trabalho coletivo e/ou colaborativo. O quadro 1 reúne o conjunto de aplicativos testados no âmbito da pesquisa.
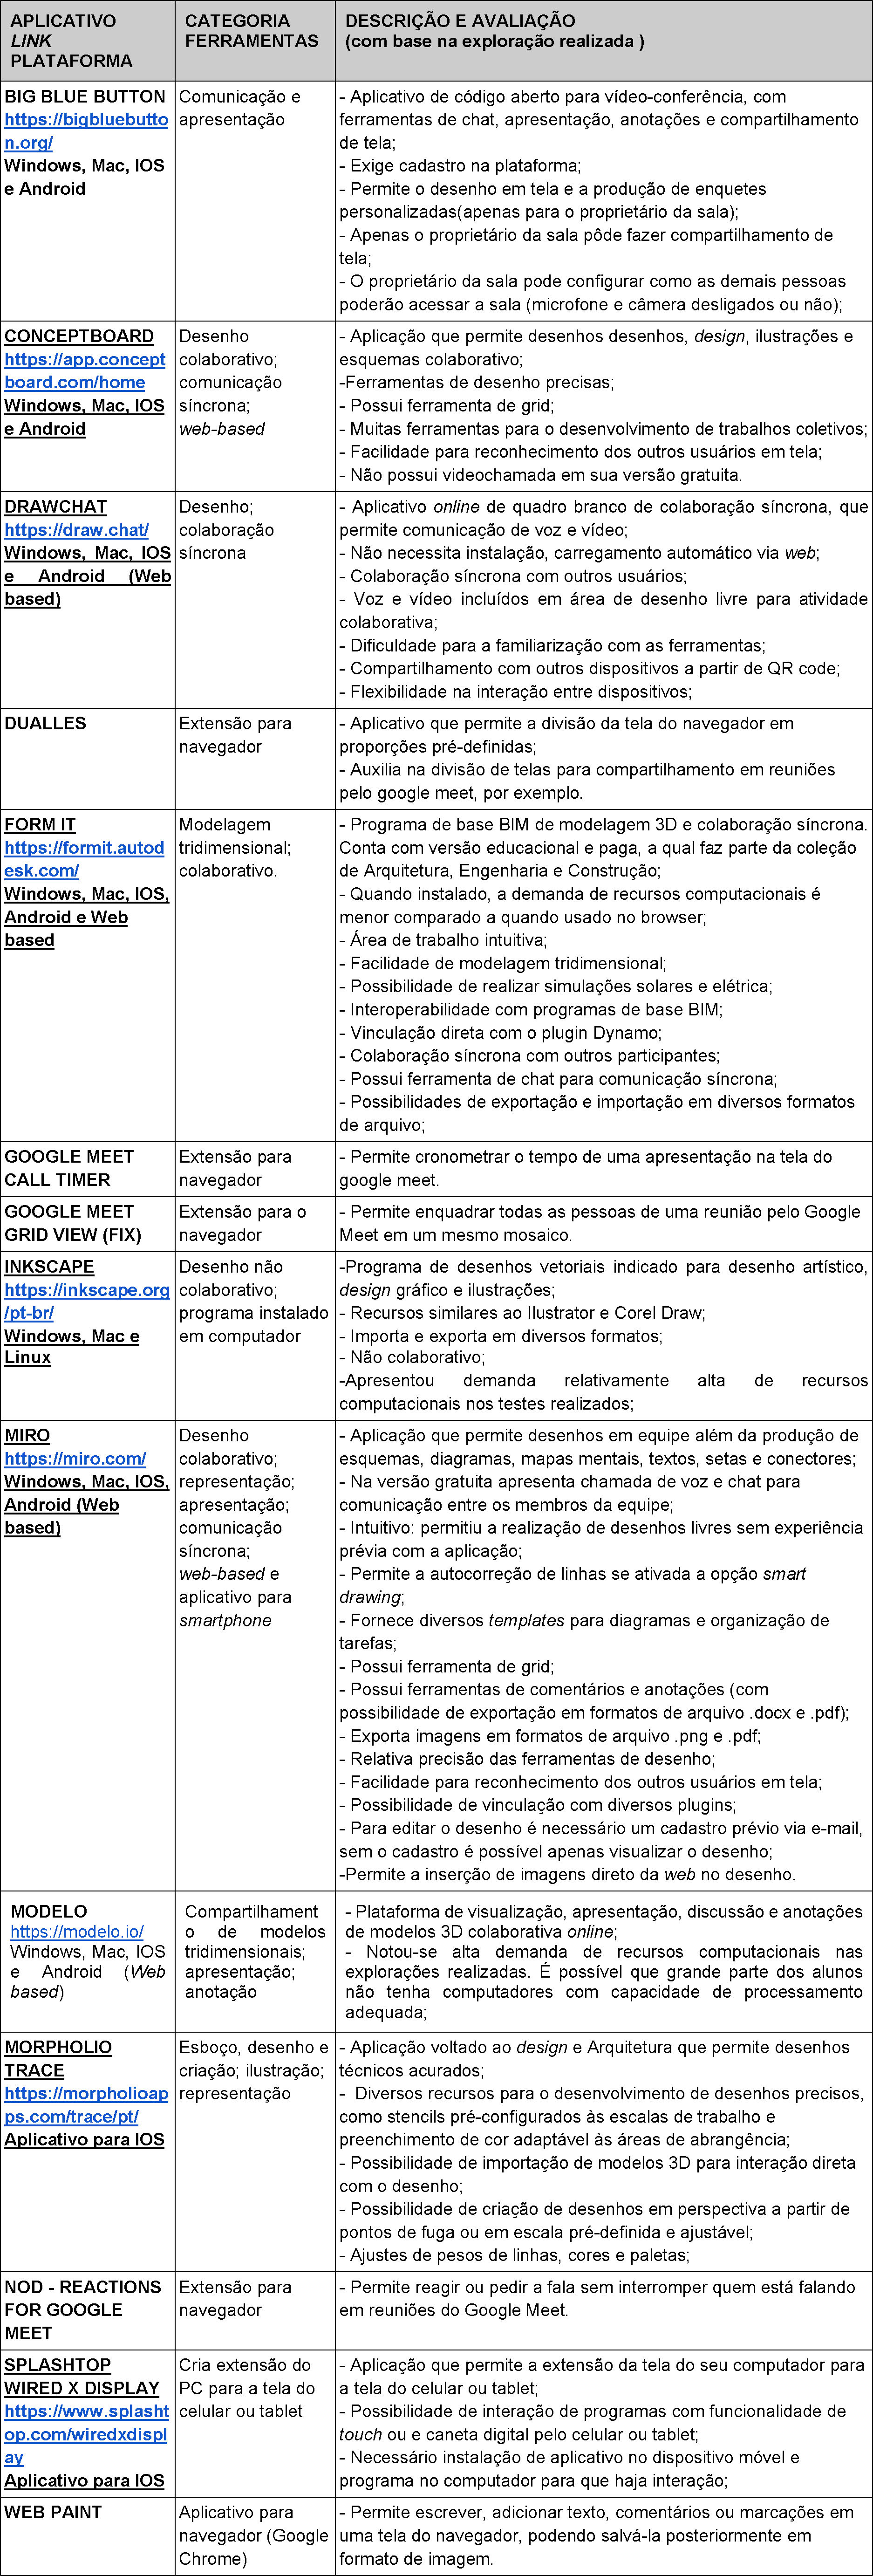
Quadro 1: Aplicativos testados. Fonte: Autores, 2020.
No conjunto dos aplicativos testados, não foi possível encontrar algum que fornecesse satisfatoriamente meios de representação, modelagem e comunicação síncrona, simultaneamente em uma versão gratuita. Todavia, uma solução que se mostrou interessante foi a de associar dois ou mais aplicativos, por exemplo, a videoconferência via Google Meet, para a comunicação, e aplicativo Miro, para a construção de esboços e desenhos colaborativos. Neste caso, as explorações envolveram videochamadas com o objetivo de produzir desenhos que tipicamente podem ser desenvolvidos em ambientes de ensino de projeto de arquitetura, como de plantas, cortes e desenhos de curvas de nível.
Também foi investigado se os aplicativos teriam outros recursos, além de linhas e formas básicas usuais, que pudessem auxiliar em sessões de trabalho durante os processos de projeto. Recursos do aplicativo de desenho colaborativo Miro, por exemplo, permitiram acrescentar comentários e fazer menção a colaboradores que podem ficar armazenados ou serem resolvidos de maneira assíncrona, se necessário. Neste aplicativo também foi possível acrescentar imagens ou capturas de tela a partir de links da web. As imagens poderiam então ser discutidas, comentadas e alteradas no ambiente do Miro através de recursos de desenho disponíveis.
Outra exploração envolveu aplicativos que permitem a extensão de tela dos computadores pessoais para tablets, pois buscava-se utilizar o tablet ou outros dispositivos móveis de maneira análoga a uma mesa digitalizadora. A exploração foi motivada pelo fato de que alunos ou docentes das disciplinas de projeto poderiam ter mais facilidade no desenho à mão, e isso poderia ser feito com canetas específicas de desenho digital ou com o dedo, por exemplo.
As explorações empregando diferentes aplicativos demonstraram ser possível a realização de atividades que permitissem a comunicação e produção de peças gráficas e de representação de maneira síncrona. Todos os aplicativos foram testados em versões gratuitas, de modo que não houvesse custos para os participantes. Foram utilizadas versões de aplicativos gratuitos, ou que apresentassem pelo menos alguma versão gratuita (neste caso, esta foi a versão testada), ou, ainda, versões educacionais.
Embora os aplicativos não devessem gerar custos para os participantes, o levantamento inicial resultou em um grande número de aplicativos, gratuitos e pagos. A lista completa dos aplicativos levantados mas não testados encontra-se no quadro 2.
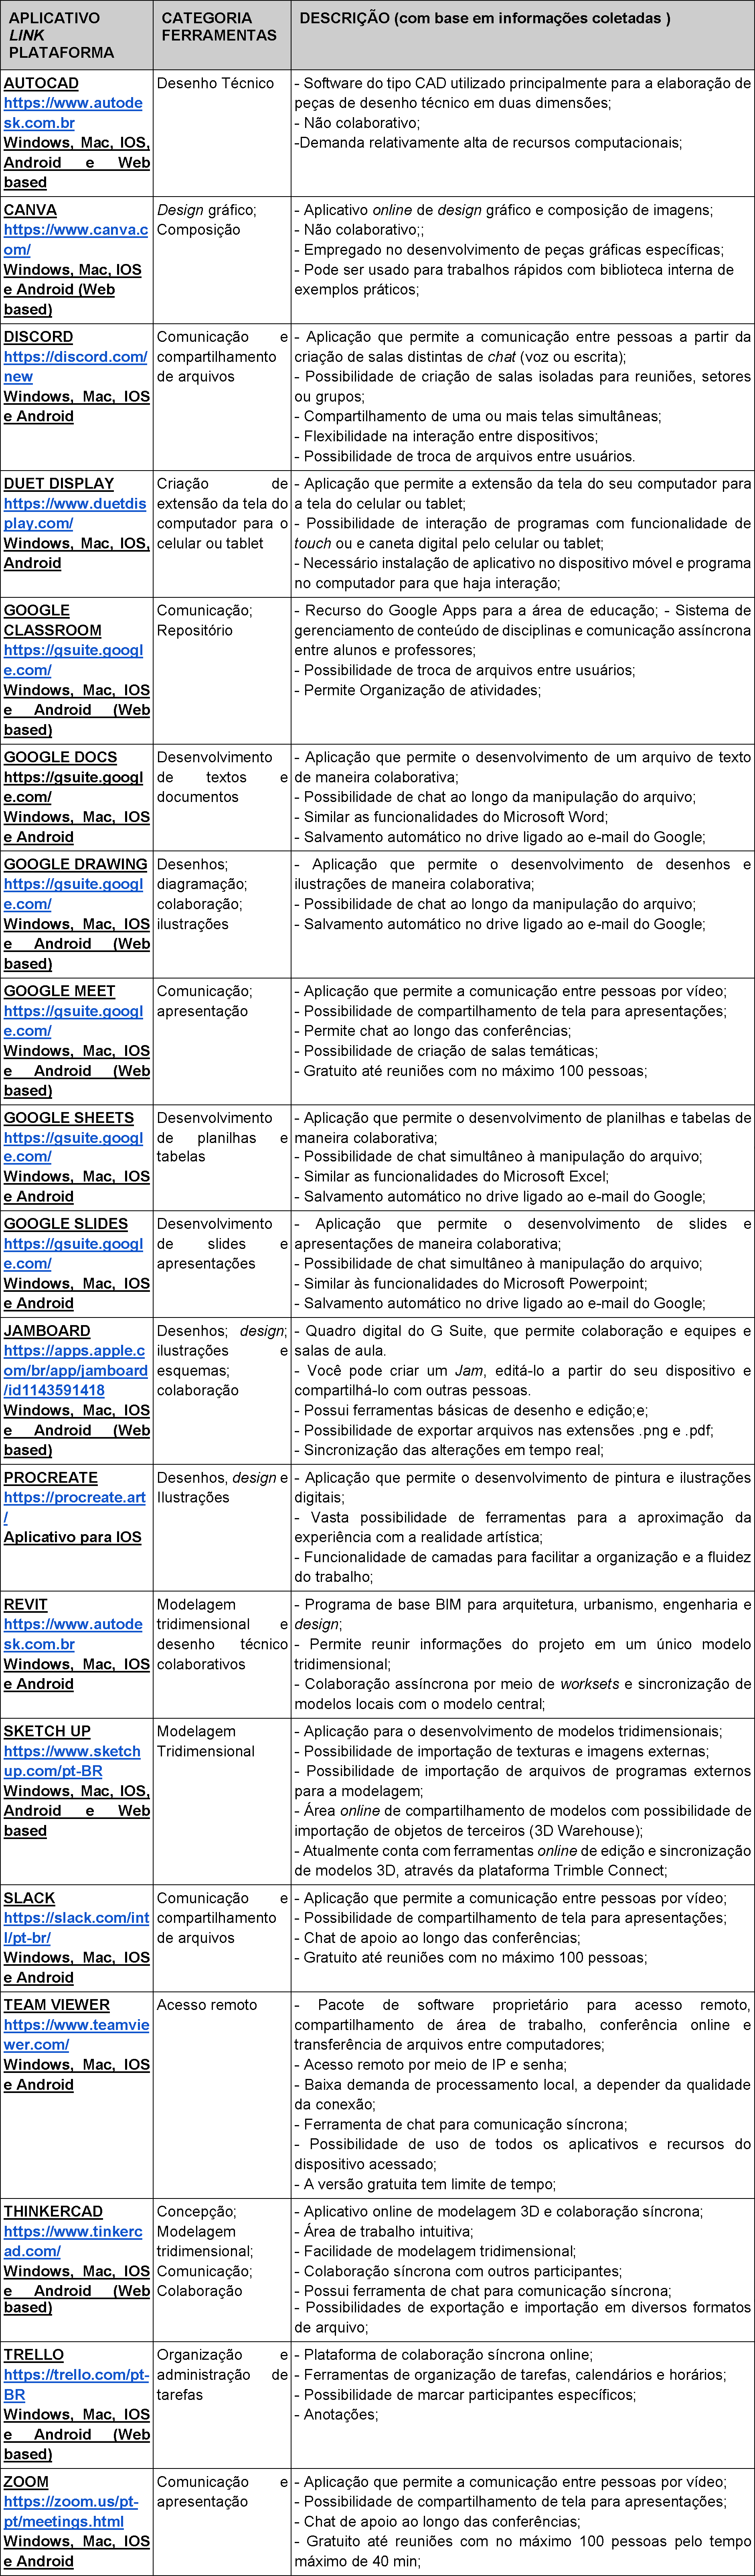
Quadro 2: Aplicativos não testados. Fonte: Autores, 2020.
7 Produtos
Conforme o terceiro objetivo específico do projeto Remote Design Studio, os pesquisadores do Nomads.usp procuraram estimular a interlocução sobre o ensino remoto de projeto em fóruns acadêmicos tanto internos como externos ao Instituto de Arquitetura e Urbanismo - IAU-USP. Essa interlocução se deu através de divulgação de resultados e de sessões de capacitação de uso de aplicativos e websites. Em ambos os meios, os participantes poderiam comentar e discutir os dados, resultados e reflexões apresentadas.
A divulgação de resultados da pesquisa iniciou-se entre meados de julho e agosto de 2020, estendendo-se até o presente.
i. Apresentação dos resultados parciais da pesquisa aos pesquisadores do Nomads.usp, na reunião geral de agosto de 2020;
ii. Apresentação de dados brutos parciais aos professores de Projeto do IAU-USP no formato de um Prompt Report. Apresentaram-se dados preliminares do questionário, aplicativos levantados e reflexões sobre o ensino remoto a partir das respostas abertas recebidas até então;
iii. Palestra do pesquisador Mario Vallejo no ciclo de conferências virtuais organizado pelo Colectivo de Estudiantes de la Sociedad Colombiana de Arquitectos Regional Tolima - CESCA TOLIMA. Na conferência, participaram professores, alguns respondentes do questionário, e alunos de cursos de Arquitetura de vários países da América Latina;
iv. Publicação do artigo "Remoto online, ensino de projeto: lições de uma pandemia" no periódico Arquitextos, discutindo os resultados da pesquisa. (TRAMONTANO, M. et al., 2020);
v. Publicação deste Relatório Final, em português e inglês, no periódico V!RUS;
vi. Realização de sessões de capacitação no uso de aplicativos e websites, no IAU-USP, para alunos e professores.
As sessões de capacitação foram realizadas em seguida às atividades exploratórias da pesquisa e ocorreram em nível institucional. Realizaram-se três sessões de capacitação voltadas a professores e pós-graduandos estagiários no Programa de Aperfeiçoamento de Ensino no IAU-USP. As sessões abordaram os programas Miro, FormIt, Inkscape, além de extensões do Google Meet para navegadores. Foram também realizadas outras duas sessões de capacitação para alunos de graduação dos cursos de Arquitetura e Urbanismo e de Engenharia Civil no âmbito das disciplinas IAU 0734 - Projeto III-B e IAU 0412 - Arquitetura e Urbanismo II, as quais focaram unicamente no uso do programa Miro.
Referências
BEHAR, P. A. O ensino remoto emergencial e a educação a distância. 6 jul. 2020. UFGRS. Disponível em: https://www.ufrgs.br/coronavirus/base/artigo-o-ensino-remoto-emergencial-e-a-educacao-a-distancia/. Acesso em: 09 dez. 2020.
BRASIL. Ministério da Educação. Portaria nº 343, 17 março 2020. Impensa Nacional. Disponível em: https://www.in.gov.br/en/web/dou/-/portaria-n-343-de-17-de-marco-de-2020-248564376. Acesso em: 09 dez. 2020.
CRABIÉ, M. Le télétravail en agence d'architecture, quand l'émulation collective n'y est pas. In: Tema.archi [online]. 9 de junho de 2020. Disponível em: http://tema.archi/articles/le-teletravail-en-agence-d-architecture-quand-l-emulation-collective-n-y-est-pas-1. Acesso em: 10 out. 2020.
TRAMONTANO, M.; VALLEJO, M.; SILVA FILHO, M. J.; MEDEIROS, D. C. Remoto online, ensino de projeto: lições de uma pandemia. Arquitextos [online]. 247.05. Dezembro, 2020. Disponível em: https://www.vitruvius.com.br/revistas/read/arquitextos/21.247/7967. Acesso em: 14 dez. 2020.
UNESCO. Instituto Internacional para a Educação Superior na América Latina e Caribe (IESALC). COVID-19 e educação superior: dos efeitos imediatos ao dia seguinte. 13 maio 2020. Disponível em: https://unesdoc.unesco.org/ark:/48223/pf0000374886. Acesso em: 09 dez. 2020.
1 No Brasil, é usual que o ano letivo coincida com o ano civil se dividindo em: 1º semestre (de janeiro a junho) e 2º semestre (de julho a dezembro). Recessos costumam ocorrer entre meados de dezembro de um ano e de janeiro do ano seguinte e em julho. É importante ressaltar que, frente à pandemia, diversas instituições tiveram que readequar seus calendários de modo que, eventualmente, o ano letivo deixou de coincidir com o ano civil.
2 Chamamos de aplicativos os meios computacionais reunidos no trabalho de pesquisa, incluindo (mas não restrito a) programas computacionais, interfaces de vídeo chamadas, plataformas digitais e extensões de navegadores.
Remote Design Studio Project: final report
Marcelo Tramontano is an Architect, Master, Doctor, and Livre-docente in Architecture and Urbanism, with a Post-doctorate in Architecture and Digital Media. He is an Associate Professor at the Institute of Architecture and Urbanism of the University of Sao Paulo, Brazil, and the Graduate Program in Architecture and Urbanism of the same institution. He directs Nomads.usp and is the Editor-in-Chief of V!RUS journal. tramont@sc.usp.br http://lattes.cnpq.br/1999154589439118
Mario Vallejo is an Architectural and Engineering Draftman, and holds a Master's degree in Architecture. He is a researcher at Nomads.usp, and Ph.D. candidate in the Graduate Program in Architecture and Urbanism at the Institute of Architecture and Urbanism of the University of Sao Paulo, Brazil. He studies digital design processes, collaboration, BIM, and methods and means of representation. mariovallejo@usp.br http://lattes.cnpq.br/1094158283404582
Maurício José da Silva Filho is an Architect and Urbanist and a researcher at Nomads.usp, in the Postgraduate Program in Architecture and Urbanism at the Institute of Architecture and Urbanism at the University of São Paulo, Brazil. He also studies Information Systems at the same university and researches the use of digital media (parametric design and digital fabrication) within the architectural design process. mauricio.jose.filho@usp.br http://lattes.cnpq.br/7246231958331765
Danilo Cazentini Medeiros is an Architect and Urbanist, Designer and Illustrator, and specialized in Interior Design. He is currently a Head of Design at the company Cross Reality Educacross, and a researcher at Nomads.usp studying representation means in the design process. dan.medeiros@usp.br http://lattes.cnpq.br/7546949898123957
How to quote this text: Tramontano, M.; Vallejo, M.; Silva Filho, M. J.; Medeiros, D. C., 2020. Remote Design Studios Project: final report. Translated from Portuguese by Maurício José da Silva Filho e Marcelo Tramontano. V!RUS, 21, December. [online] Available at: <http://www.nomads.usp.br/virus/virus21/?sec=6&item=1&lang=en>. [Accessed: 29 April 2024].
Abstract
This paper presents the final report of the Remote Design Studios (RDS) Project. It gathers the results of a survey conducted on teachers of architecture, urbanism, and landscape design at higher education institutions. A consultation gathered information on remote online design teaching activities during the first academic semester of the Covid-19 pandemic. The survey was carried out by researchers from Nomads.usp - Center for Interactive Living Studies of the University of São Paulo, Brazil, from June to August 2020, and included 166 respondents from institutions in 14 countries. This report presents information referring to respondents from Brazilian educational institutions located in 14 states. The methodology included a consultation through an online questionnaire, a gathering of student design exercises made available by some interviewees, and the collection of suggestions for computational applications especially suitable for remote design processes.
Keywords: Design teaching, Remote teaching, COVID-19, Survey
The Remote Design Studios Project provided questionnaires to interviewees in Portuguese, English, and Spanish, which are available at:
Portuguese: https://bit.ly/3eDAQCC
English: https://bit.ly/3i5daJt
Spanish: https://bit.ly/2ZdVCSL
1 Introduction
The new coronavirus pandemic has influenced social relationships in different aspects of everyday life. The new reality imposed restrictions on the use and access to collective spaces, where intense exchanges between individuals used to take place. Academic activities are among those that have been subject to suspension restrictions since March 2020. In May of the same year, the International Institute for Higher Education in Latin America and the Caribbean (UNESCO IESALC) estimated in a report that, only in this region, the temporary closure of higher education institutions had already affected 23.4 million students and 1.4 million teachers. At the time, this meant "more than 98% of the region's higher education student and teacher population." (UNESCO, 2020, p. 12).
In Brazil, the Ministry of Education Ordinance No. 343 authorized, since March 17, 2020, “exceptionally, the substitution of face-to-face in-progress courses, for classes that use information and communication means and technologies” (Brasil, 2020, our translation). Although this ordinance addresses the higher education institutions of the Federal Education System, public and private institutions in the states and municipalities also had to follow it. Some of them have simply suspended teaching activities, while several public and private institutions have implemented a remote teaching modality that differs from face-to-face classes and the commercially-known distance learning or EAD in the Brazilian acronym.
In such a context, Nomads.usp - the Center for Interactive Living Studies, from the Institute of Architecture and Urbanism of the University of Sao Paulo, Brazil, conducted the research project Remote Design Studios (RDS), surveying teachers of architecture, urbanism, and landscape design on their modes of communication and didactic-pedagogical procedures in remote undergraduate courses taught during the first semester of the Covid-19 pandemic1. The consultation was carried out through an online questionnaire, available in Portuguese, Spanish, and English. This report aims to make publicly available part of the raw data obtained from the responses to the questionnaire, which were received between June 24 and August 10, 2020.
Dr. Patrícia Alejandra Behar, Full Professor at the Faculty of Education of the Federal University of Rio Grande do Sul, Brazil, and researcher on pedagogical models for Distance Learning and Informatics in Education, says that in the context of the coronavirus pandemic
It was necessary to think about Internet-mediated pedagogical activities, punctual and applied according to the restrictions imposed by Covid-19, to minimize the impacts on learning arising from in-person teaching. The curriculum of most educational institutions was not designed to be applied remotely. (Behar, 2020, our translation, emphasis added)
Students and teachers had to face doubts and uncertainties arising from the need to adapt face-to-face activities to the remote mode. Although such adaptations have been implemented in the various areas of knowledge, we highlight significant impacts for the courses and activities in theoretical-practical training. The warning had already been pointed out in May 2020 in an IESALC report:
We must also consider that those subjects which include the development of professional competences through practice (clinics, pedagogical residencies, design careers, engineering, science, and generally all those heavily dependent on practical workshops, laboratory work, or institutional practices) are a source of greater uncertainty, which will lead to a number of differentiating effects at each university, and on a systemic scale. (Unesco, 2020, p. 25, emphasis added)
Indeed, since face-to-face activities were suspended at universities, the teaching of architecture and urbanism and, especially, the teaching of design faced the question of how to carry out remotely activities that are typically guided by practices and discussions. They involve means, such as the design and production of models (both physical and digital), that are commented on, criticized, and reworked collectively and synchronously. Besides, the training of architects and urban planners often involves field and construction site visits. Such activities put students and teachers in contact with other agents and stages of the design and production processes, whether on an architectural, urban, or landscape scale.
On the other hand and out of campuses, there is a practice little systematized and little known in Brazil, which involves architects working remotely in architecture offices, especially in industrialized countries, since before the current pandemic. They work both on large international projects or local-scale interventions and rarely meet teammates in person. This practice was already supported by BIM applications and videoconferencing discussions and has become a reference this year for, for example, French offices required by law to telework (Crabié, 2020). The assertion, much heard among design teachers, that it is not feasible to teach architectural design in remote mode, is thus opposed to the question "How to train architects to compose such teams, qualified to develop collaborative projects at a distance?".
This report is structured into three main parts: 1] the project goals, 2] the methodological procedures employed, and 3] the results. The objectives and methodological procedures are described in specific items (items 2 and 3, respectively). The results presentation is divided into three items that aim to: characterize the respondents (item 4); present a reading of the responses highlighting the most expressive percentages for each question (specific to respondents attached to Brazilian educational institutions, item 5); and present a collection of applications suitable for online design discussions (suggested by respondents from Brazilian and foreign educational institutions, and by Nomads.usp researchers, item 6).
2 Research objectives
This survey was intended to consult teachers and professors of architecture, urban, and landscape design on modes of communication and didactic-pedagogical procedures in remote online undergraduate courses taught during the COVID-19 pandemic. The querying involved faculty members from schools of architecture in Brazil, Latin America, and further countries, and had as main goals:
i. Producing an overview of remote teaching modes of architecture, urbanism, and landscape design during the COVID-19 pandemic;
ii. Contributing to the formulation of remote design courses to be offered during the confinement period;
iii. Expanding reflection on online collaborative activities in design teaching;
iv. Contributing to the discussion on the inclusion of face-to-face/remote hybrid structures in regular design courses;
v. Stimulating dialogue on this topic, by disseminating results in academic circles.
3 Methodological procedures and activities carried out
The main methodological procedures were a consultation through a questionnaire, the systematization and analysis of collected data, and an exploratory investigation of computer applications. The activities carried out included: 3.1. The questionnaire preparation and dissemination; 3.2. The reading, systematization, and analysis of collected data; and 3.3. The testing and exploration of computer applications.
3.1. The questionnaire preparation and dissemination
The online questionnaire was prepared using the Google Form tool. Questions were defined in a remote meeting of the project's researchers. In addition to respondents' personal and professional information (name, e-mail, and institution), the final questionnaire included questions of the following nature:
i. On the activities carried out: These questions refer to the exercises' scale and scope, and the nature of the activities performed. For each question, a comprehensive list of answers was presented, and respondents should indicate pertinence by choosing between the Yes or No answer options.
ii. About computer applications: These questions refer to using computational applications for the representation and modeling of projects and communication between students and teachers in remote activities. In the lists of computer programs and communication applications presented, respondents should indicate their use according to the categories: Mainly, Complementarily, and Not used;
iii. On the courses' dynamics: These questions refer to the courses' structure and the classes' dynamics. To answer these questions, respondents should select an alternative from a pre-defined list;
iv. On the students and their resources: These questions refer to the attitude of students in remote activities, as well as the resources they had available according to the respondents' assessment. Questions should be answered with Yes or No;
v. Preliminary assessments: These questions sought to stimulate the respondents' perception of the activities performed. After reading statements about the activities carried out and their products, respondents should indicate their degree of agreement by selecting one of the following options: I fully agree, I partially agree, I tend to disagree, or I totally disagree.
In addition to multiple-choice questions, two written-response questions have also been proposed. One of them requested the indication of specific communication applications suitable for design discussions (the possibility of drawing on students' drawings, the possibility of drawing by hand, etc.). The other question asked respondents to make suggestions on how to improve remote design teaching courses.
The questions for each thematic axis were developed by the project researchers and, once defined, were made available to all Nomads.usp researchers. At this stage, all researchers at the Center, in different degrees of training, could evaluate and criticize the questions and make suggestions. After this step, the link to the questionnaire went to public disclosure, as well as a presentation text and an official flyer. The release was carried out according to three strategies: by publishing on Nomads.usp social networks and by Nomads.usp researchers; by sending e-mails to graduate programs in Architecture and Urbanism, and to directors of undergraduate courses, asking them to forward the message to potentially interested people; and by sending individual e-mails to teachers in Brazil and abroad, selected in the proceedings of scientific events, and from websites of higher education institutions that offer training in architecture and urbanism.
3.2. The data reading, systematization, and analysis
After publicizing the questionnaires between June and July 2020, the responses received until August 10, 2020, were read and systematized. Data systematized in spreadsheets generated graphs that are presented in topics 4 and 5 of this report. The answers to the written question on suitable applications for design discussions helped to fill in the table presented in item 6. The answers to the written question on suggestions for improvement of remote design teaching will not be included in this report. We recommend reading the article "Remote online, design teaching: lessons from a pandemic" (TRAMONTANO et al., 2020, Portuguese only), which is dedicated to discussing the respondents’ suggestions.
3.3. The testing and exploration of computer applications
A list of computational applications used by teachers in design teaching practices has been developed from the interviewees' responses. Some applications were selected for a further exploratory phase, conducted by the project's research team. The selected applications should simultaneously offer resources for communication and representation and discussion of architectural projects. For testing them, synchronous communication sessions were held between researchers, using the suggested programs and architectural and urban planning projects.
4 About the respondents
The questionnaire targeted teachers from public and private higher education institutions in Brazil, Latin America, and abroad. At the end of the disclosure period, 655 e-mails had been sent inviting teachers to answer the questionnaire. Of these e-mails, 359 were sent to teachers from Brazilian educational institutions, 220 to teachers from institutions in other countries in Latin America, and 76 from countries in other regions of the globe. By August 10, 2020, the questionnaire had gathered 166 respondents: 124 of them from Brazil, 34 from other Latin American countries, and 8 from countries in other regions.
The number of respondents covers 14 countries, i.e. Brazil and 7 other countries in Latin America, and 6 countries in other regions of the world. In the case of Latin America (excluding Brazil), the group of respondents covers 17 educational institutions, and Colombia is the country with both the largest number of respondents in the region (12 respondents) and the largest number of institutions represented (5 institutions). Also represented Latinamerican countries (excluding Brazil) are Mexico, Peru, Argentina, Chile, Uruguay, and Ecuador. Figure 1 presents a complete picture of the countries with the number of respondents and institutions.
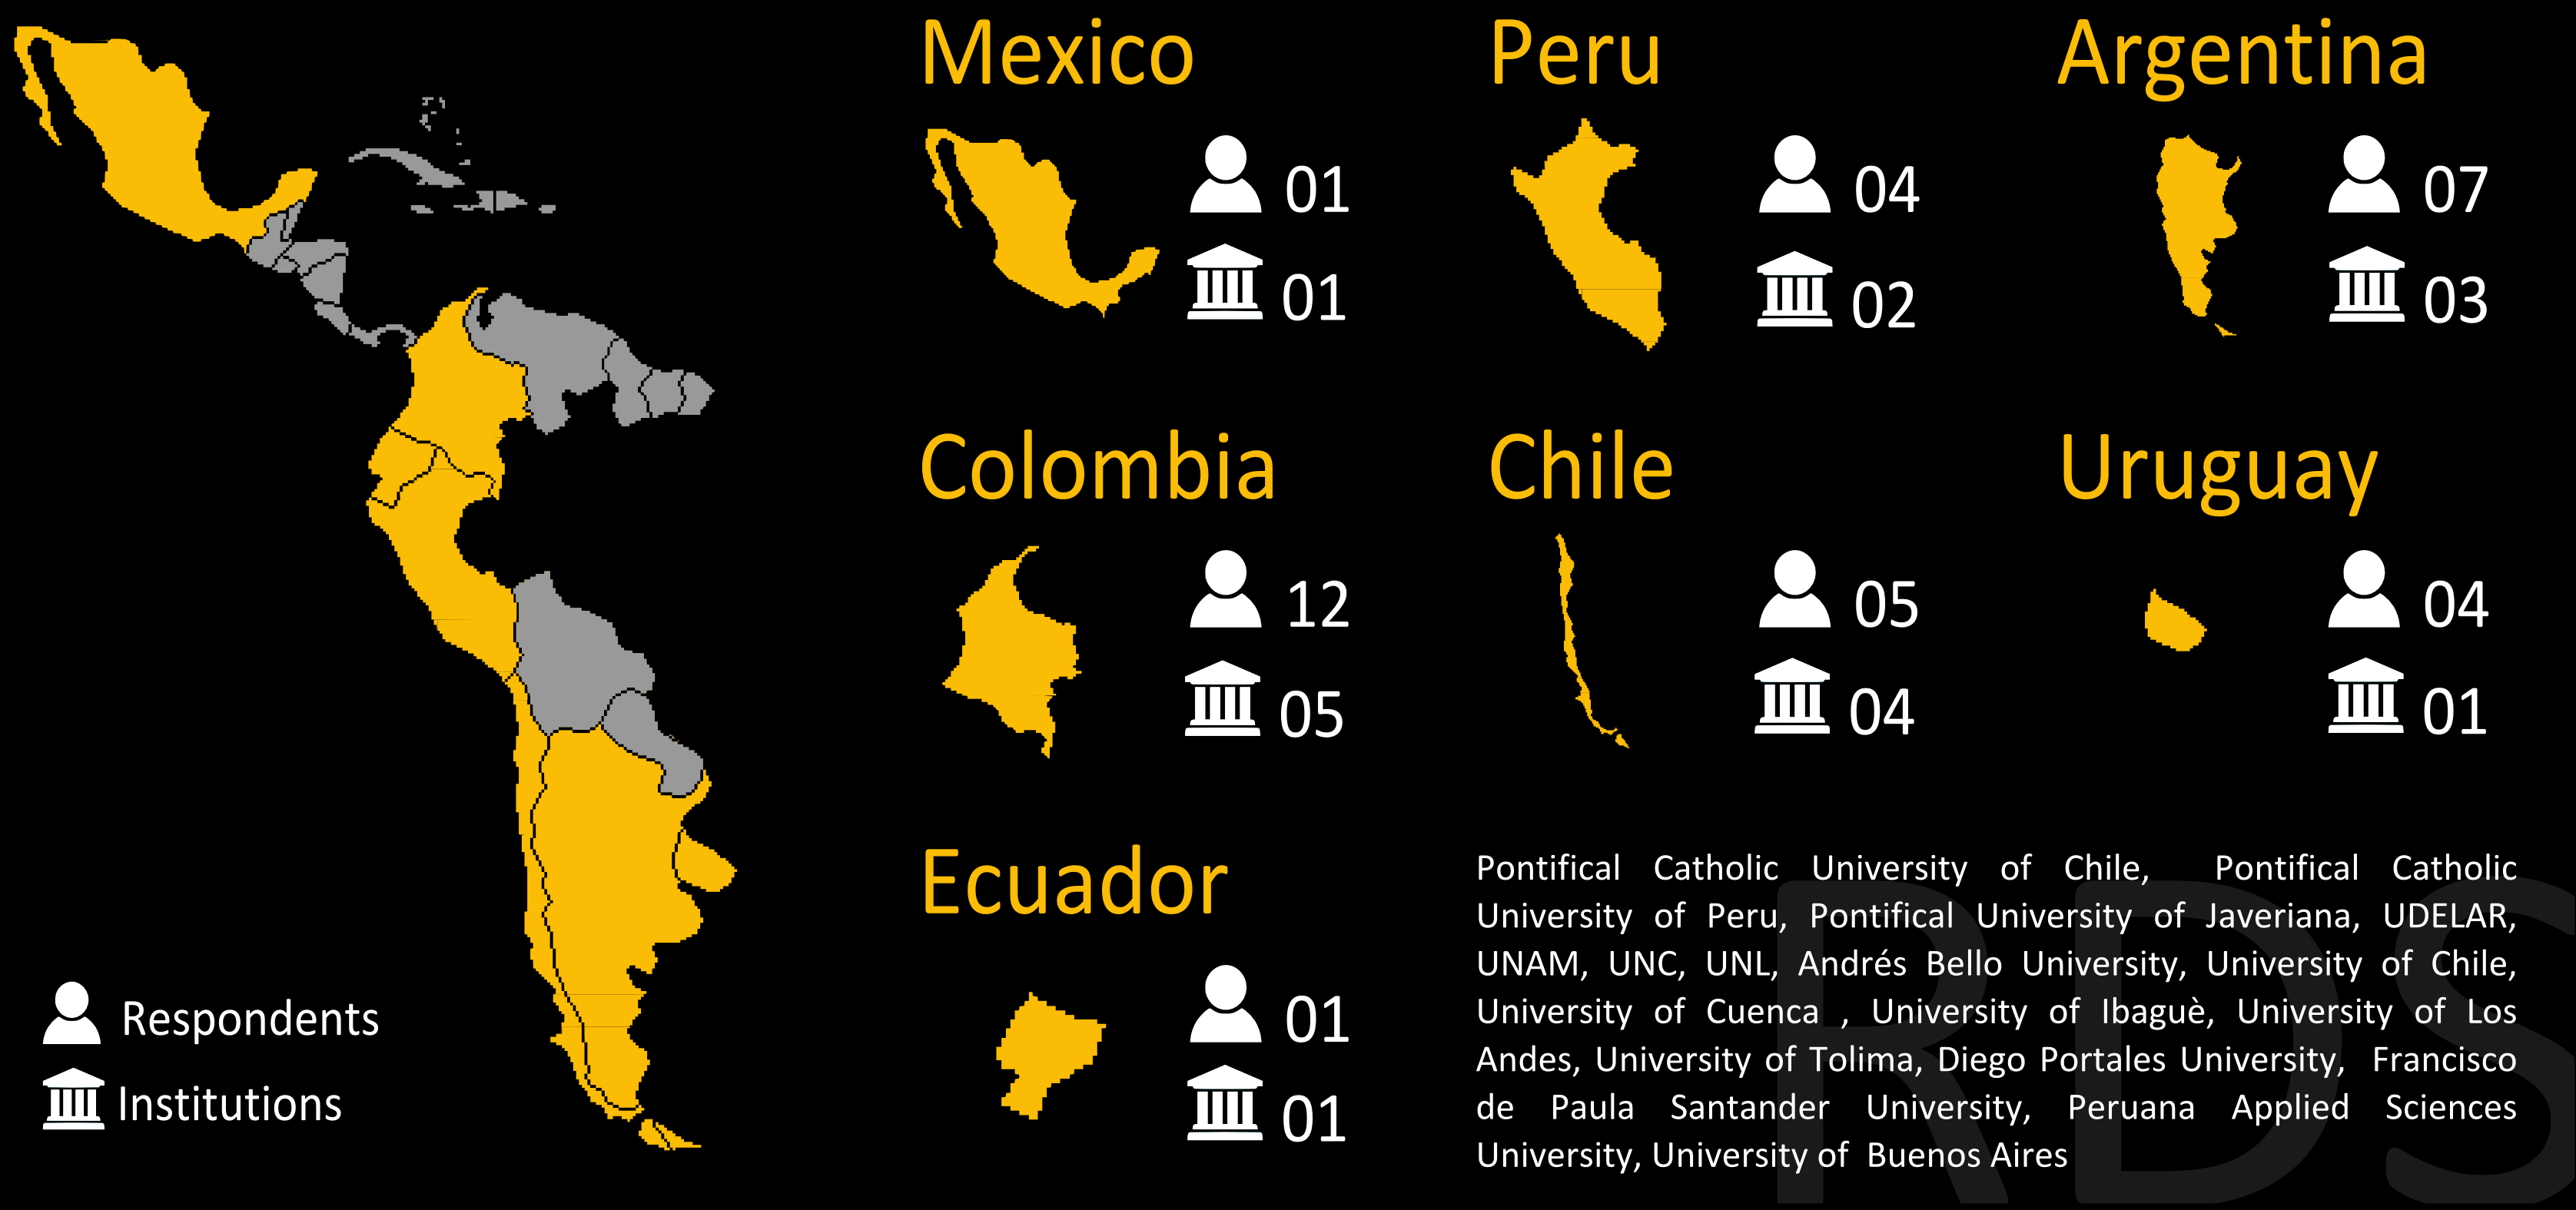
Fig. 01: Latinamerican countries (excluding Brazil) highlighting those who had respondents in the poll. Total of respondents and institutions by country, in addition to the list of institutions in the lower right corner. Source: Authors, 2020.
Regarding Brazil, the number of respondents covered 14 states, from 4 macro-regions (Northeast, Midwest, Southeast, and South). The group totals 124 respondents from 62 institutions. The state with the highest number of respondents is São Paulo, with 63 respondents from 23 institutions. Among the Brazilian institutions that had respondents, 73% are private and 27% are public. It is also noteworthy that 14 major Brazilian public institutions sent us important information, despite not offering remote courses in the first half of 2020.
The public institutions with the highest number of respondents were the Faculty of Architecture of the University of São Paulo (FAU-USP), followed by the Federal University of Mato Grosso do Sul (UFMS) and the State University of Campinas (UNICAMP). Among private educational institutions, those with the highest number of respondents were Mackenzie Presbyterian University, Paulista University (Unip), the Catholic University of Minas Gerais (PUC-MG), and the Catholic University of Rio de Janeiro (PUC-RJ). Figure 2 presents information about institutions and respondents in Brazil, as well as the list of universities that had respondents until August 10, 2020.
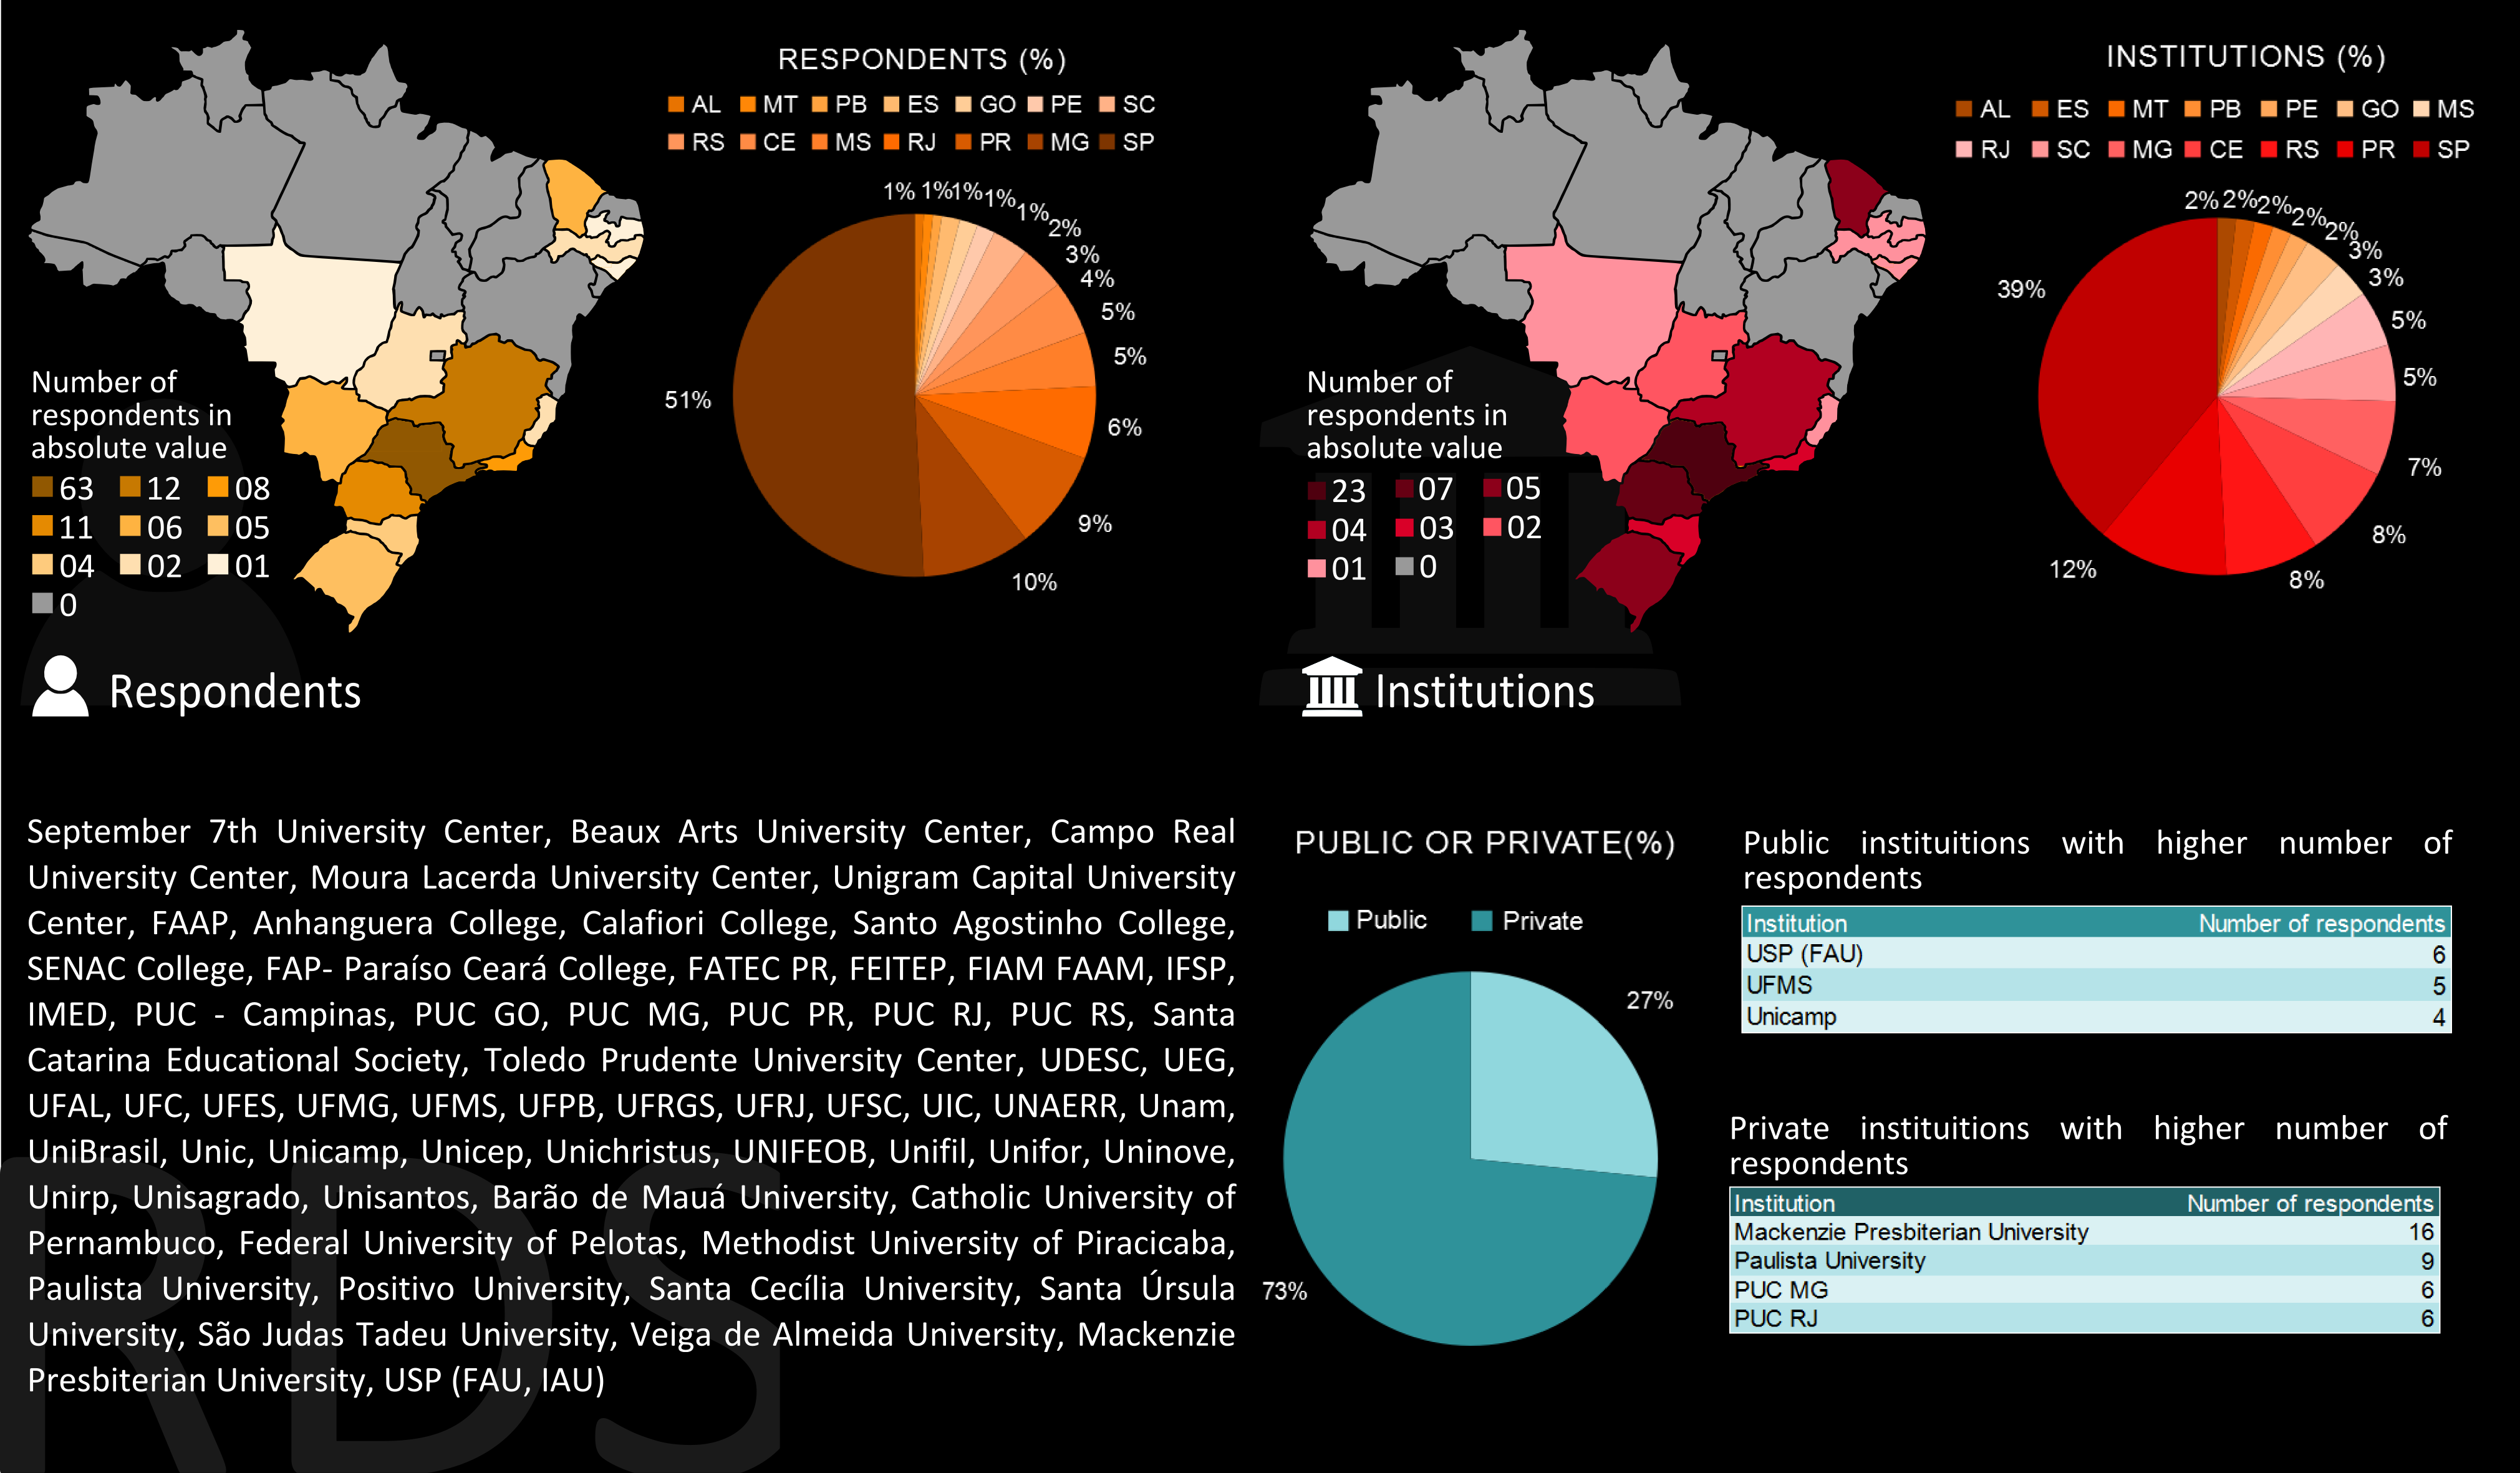
Fig. 02: Respondents by Brazilian state, by type of institution private or public, and list of participating institutions. Source: Authors, 2020.
5 Replies
This item presents the graphics resulting from the responses to the questionnaire. We introduce the questions and highlight in the text which answer options were indicated by at least half of the respondents. In the questions that propose a gradation to express the degree of agreement, we highlight both the options with the highest number of respondents and those with the least amount.
5.1. On the characterization of the courses' activities
For the question: What was the scale and scope of the exercise(s) developed with the students? Through the options, Yes or No, respondents should indicate which following project scales were considered: Architecture (building design); Urban Project (design of urban fragments); Urban Planning (territorial planning); Landscaping (design of open spaces).
Respondents could indicate one or more categories, so that the options Architecture (building design) and Urban Design (design of urban fragments) were indicated as Yes by more than half of the respondents – 75.8% and 60, 9%, respectively. Figure 3 presents the graph with the percentages of all categories.
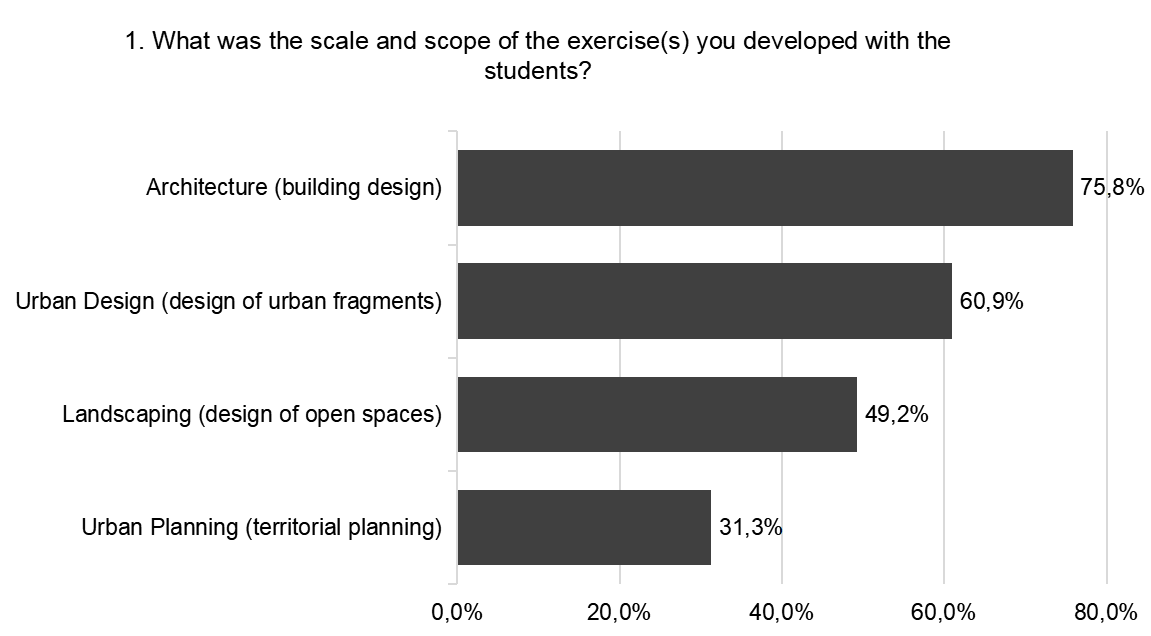
Fig. 03: Graph with the percentage of respondents who indicated the option Yes in each of the categories presented for the scale and scope of the proposed exercises. Source: Authors, 2020.
For the question: What was the nature of the activities carried out? Through the options, Yes or No, respondents should indicate which one(s) of the six groups of procedures applied.
More than half of the respondents responded Yes for all the available categories. Percentages range between 92.2%, for the category Collection and organization of information as a subsidy for the project, and 64.1%, for the category Digital modeling of urban areas or existing buildings. Numbers for all categories are shown in figure 4.

Fig. 04: Graph with the percentage of respondents who indicated the option Yes in each of the categories of proposals for the nature of the activities carried out. Source: Authors, 2020.
5.2. On computational programs
Regarding computational means, a question asked: What computer programs were used to carry out the activities? The list of choices offered six categories of computer programs that allow drawings and modeling of architectural projects. The categories Drawing by hand with an instrument, Hand drawing without an instrument, and Others were also available. For each category, respondents were asked to indicate whether they have been used Mainly, Complementarily, or Not Used at all.
The categories Graphic Programs for technical drawing and Graphic Programs for modeling were the only ones which have been indicated as being used Mainly by more than half of the respondents. None of the categories was indicated as Complementary use by more than half of the respondents, and the category Parametric Modeling programs was the only one which was indicated as Not Used by more than half of the respondents. The entire graph is shown in figure 5, below.
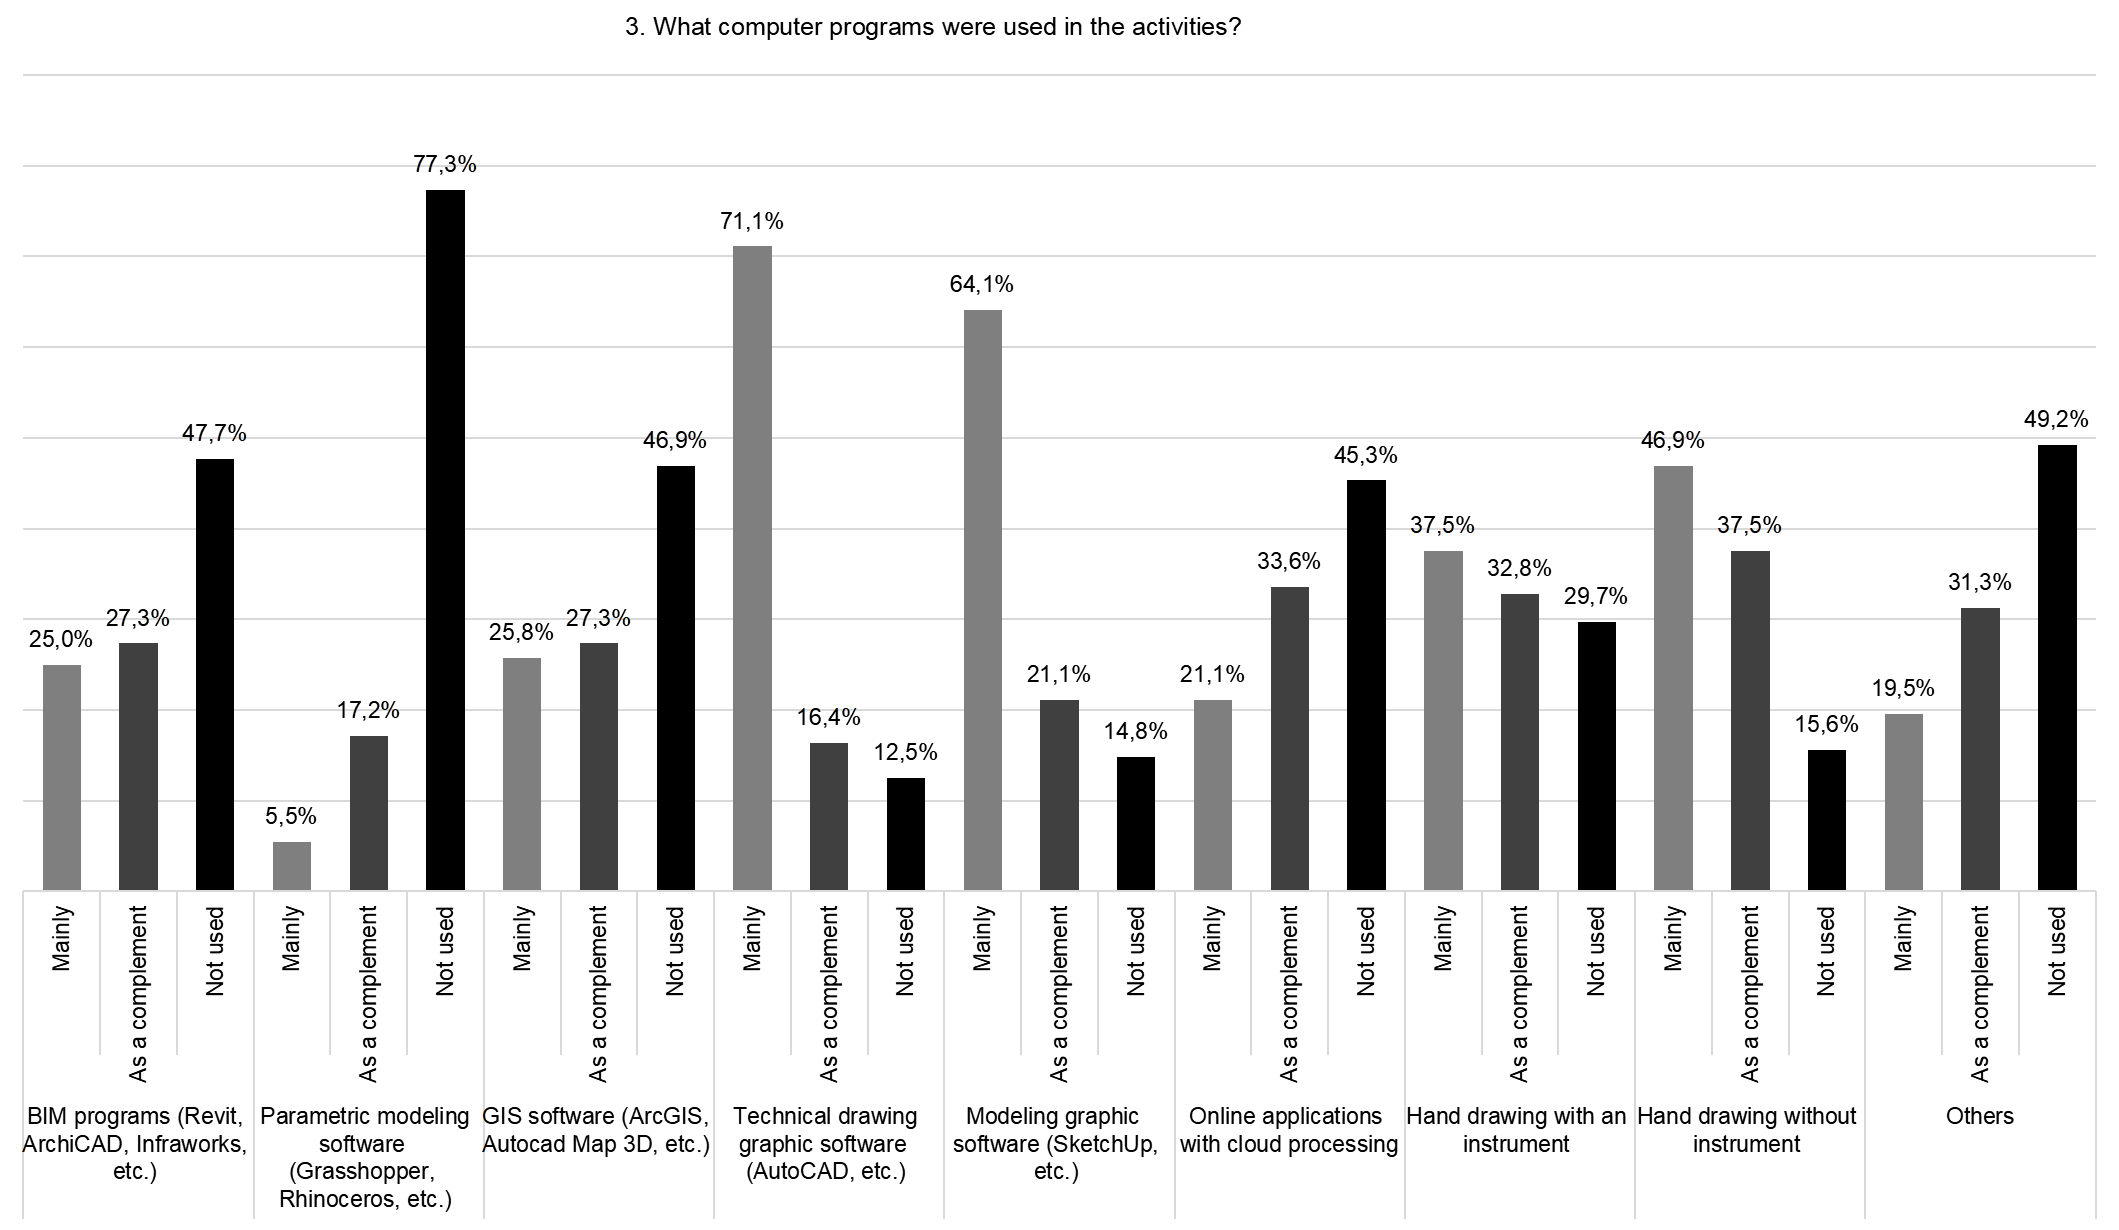
Fig. 05: Graph with the percentage of respondents who claimed to use Mainly, Complementarily or Not to use the means considered, in addition to the option Others to indicate the use of means that had not been indicated in the questionnaire alternatives. Source: Authors, 2020.
Next, respondents should answer the question: What applications were used for communication between teachers and students? As in the previous question, respondents had access to a list of applications – in addition to the option Others – and should choose among the options Mainly, Complementarily, or Not used, considering a set of indicated applications.
None of the programs was indicated by at least half of the respondents as having been used Mainly. However, Google Meet and Zoom platforms got the highest referrals – 43.8% and 43.0%, respectively. Also for the Complementary use option, none of the applications were indicated by more than half of the respondents. The option Not used was checked by more than half of the respondents in eight of the eleven options indicated. Final numbers can be accessed in figure 6.

Fig. 06: Graph with the percentage of respondents who claimed to use Mainly, Complementarily or Not to use the applications, in addition to the option Others. Source: Authors, 2020.
5.3. On the disciplines dynamic
Regarding the courses' dynamics, two questions were initially asked: 1] The FACE-TO-FACE course exercises are usually done individually or in groups? and 2] The ONLINE course exercises were done individually or in groups?. For each of the questions, respondents should indicate whether the exercises were performed individually, in pairs, or groups.
Although the percentages are different in the face-to-face and online courses, in both cases most respondents indicated that the exercises occurred in groups (54% in the face-to-face and 45% in the online mode), followed by the percentage of individual exercises (34% in the face-to-face modality and 41% in the online modality) and, finally, exercises in pairs (12% in the face modality and 14% in the online modality). Figure 7 shows the graphs with the answers.
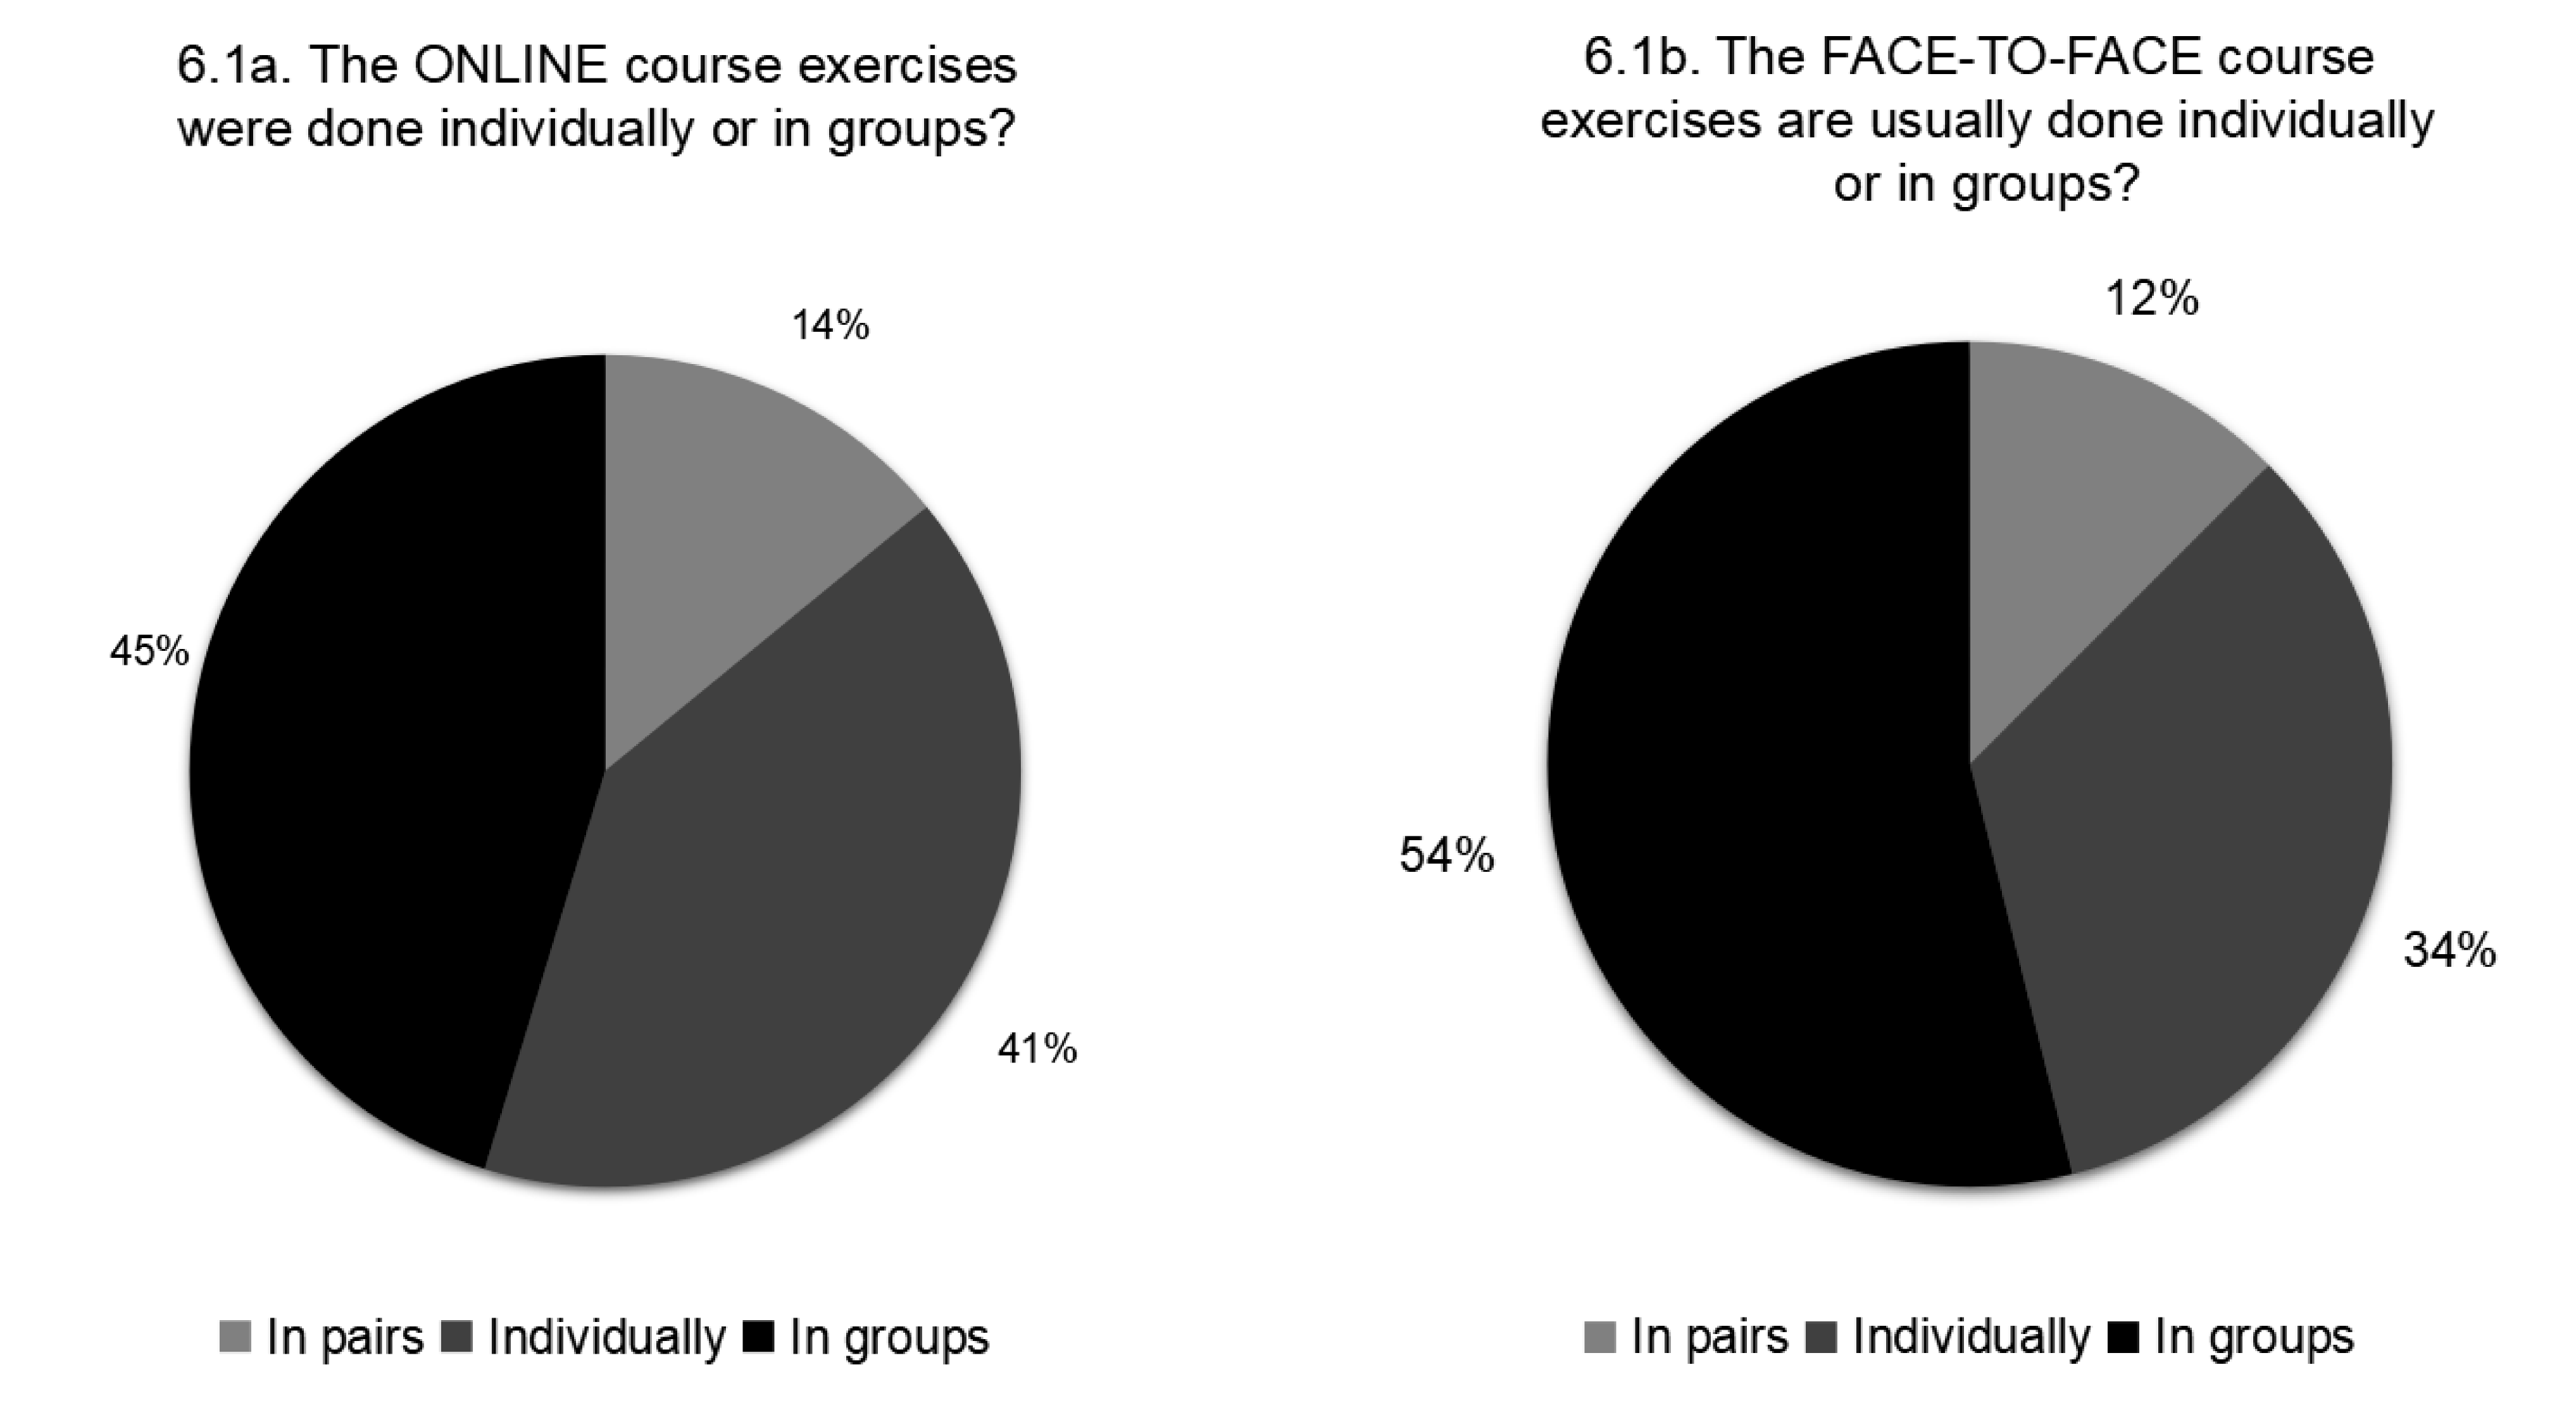
Fig. 07: Graphs with the percentages indicating the number of students in the activities carried out in the online and in-person modalities. Source: Authors, 2020.
The following question was asked regarding the online course: How many students are there in the class? Respondents should choose between four intervals as explained in the subtitle of the graph in figure 8. Most respondents (56%) indicated that their class had 30 students or less, followed by 32% who indicated classes between 31 and 50 students. The remainder 6% of respondents indicated that they had between 51 and 70 students in their classes, and another 6% indicated that they had worked with classes with more than 100 students. Other choices had no mention. The corresponding graph is in figure 8 below.
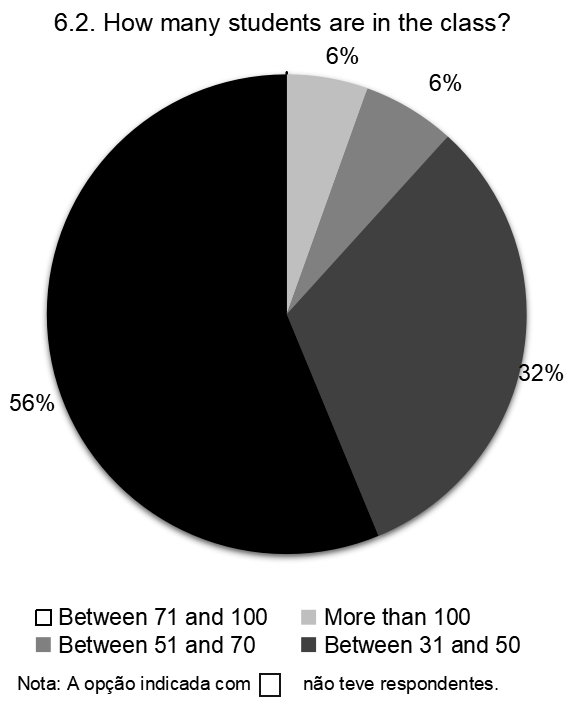
Fig. 08: Graph with percentages indicating the number of students in the classes of remote activities. Source: Authors, 2020.
About the length of the exercises, interviewees were asked: How many weeks did the exercises last? None of the options was indicated by at least half of the respondents. However, among the 9 options proposed, according to the subtitle of the graph in figure 9, the sum of the first 3 options with the highest number of respondents exceeds 50%. The options with the highest number of respondents were 4 to 5 weeks (21%), less than 4 weeks (20%), and 15 to 16 weeks (16%).
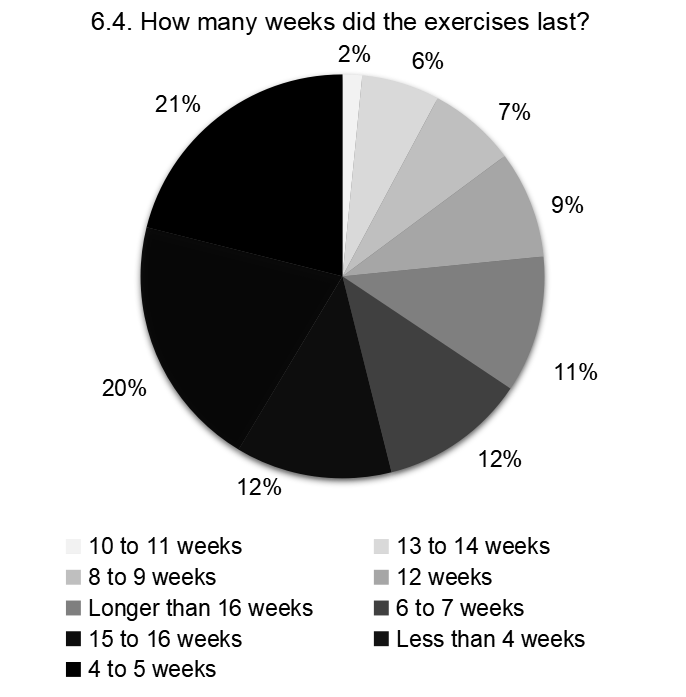
Fig. 09: Graph with the percentages of respondents for the length of the proposed exercises. Source: Authors, 2020.
Regarding the frequency of consultations, the question was asked: How often did each student or group have a work session with the teacher(s)? The Weekly option was chosen by 87% of the respondents, and the remainder answers were distributed among the rest of the options, as shown in the graph in figure 10.

Fig. 10: Graph with the percentages of respondents for the duration of the proposed exercises. Source: Authors, 2020.
Regarding the length of each guiding session, interviewees were asked: In general, how long did each work session last? The option Less than 30 minutes was indicated by 52% of respondents, followed by 29% who indicated that the sessions lasted between 30 and 45 minutes, and by 8% who indicated the guiding sessions lasted more than 120 minutes. The percentages of all options are shown in the graph in figure 11.

Fig. 11: Graph with the percentages of respondents for the duration of visits. Source: Authors, 2020.
5.4. On the students and their resources
This set of questions raised data on students' participation in the proposed activities. The questions sought to find out if the institutions carried out surveys to know the reality of students in their home environment, what was the students' attitude towards the proposed activities, and how the interviewees classified the students' resources to carry out the activities.
Regarding the conduct of surveys with students, the following question was asked: Was a survey conducted with students to map their work-at-home conditions? Respondents should choose between Yes or No, so 58% indicated the answer No, and 42% indicated the answer Yes, as shown in the graph in figure 12.

Fig. 12: Graph with the percentages of Yes and No of respondents for the question about surveying students. Source: Authors, 2020.
Additionally, the following question was asked: If so, would it be possible to have access to the questions and results? In this case, 80% of respondents indicated the answer No, and 20% indicated Yes, as shown in the graph in figure 13.

Fig. 13: Graph with the percentages of Yes and No of the respondents for the question about giving the researchers access to the survey results with the students, if it exists. Source: Authors, 2020.
Regarding the respondents’ impression of the students' attitude towards the proposed activities, the following question was asked: Was there any resistance from the students to the new activities proposed by the teachers? In this case, 70% of the respondents indicated the option No and 30% indicated Yes, as shown in the graph in figure 14.

Fig. 14: Graph with the percentages of Yes and No of the respondents about some resistance of the students to the new activities proposed by the teachers. Source: Authors, 2020.
Regarding the influence of the students’ resistance to the proposed activities, the following question was asked: Did this resistance prevent/delay/hinder the activities? In this case, 81% of the total respondents answered No and 19% answered Yes, as shown in the graph in figure 15.

Fig. 15: Graph with the percentages of Yes and No of the respondents for the question about the influence of the students’ resistance to the proposed new activities. Source: Authors, 2020.
About the students' dedication to remote activities, the following question was asked: Was the students' dedication more remarkable than in the face-to-face course? The answer No was chosen by 55% of the respondents, and 45% indicated the answer Yes, as shown in the graph in figure 16.

Fig. 16: Graph with the percentages of Yes and No of the respondents for the question about the dedication of students in a face-to-face course. Source: Authors, 2020.
Regarding the students' resources to carry out remote activities, the following question was asked: Did most students have a suitable computer? The answer Yes was chosen by 79% of respondents, while 21% indicated the answer No, according to the graph in figure 17.
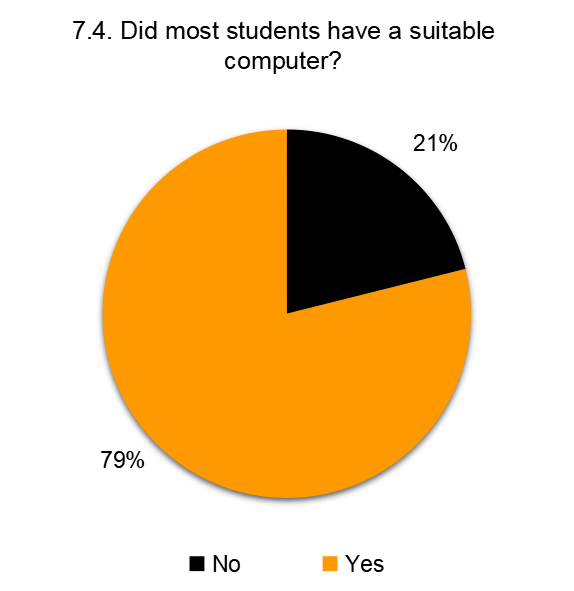
Fig. 17: Graph with the percentages of answers Yes and No for the question about the majority of students having an adequate computer. Source: Authors, 2020.
Still, about the students' resources, the following question was asked: Did most students have an adequate Internet connection? For this question, 75% of respondents indicated the answer Yes, while 25% indicated the answer No, according to the graph in figure 18.
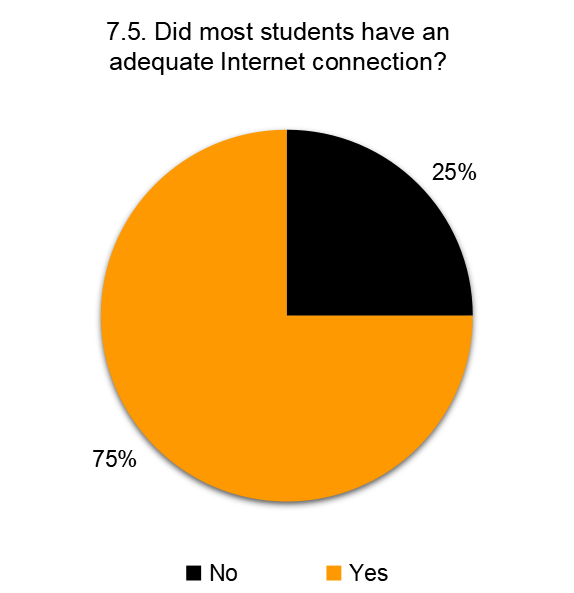
Fig. 18: Graph with the percentages of Yes and No answers to the question about the majority of students having an adequate internet connection. Source: Authors, 2020.
Finally, regarding the students' home environment, the question was asked: Did most students have good conditions at home? For this question, 76% of respondents indicated the answer Yes, while 24% indicated the answer No, as indicated in the graph in figure 19.
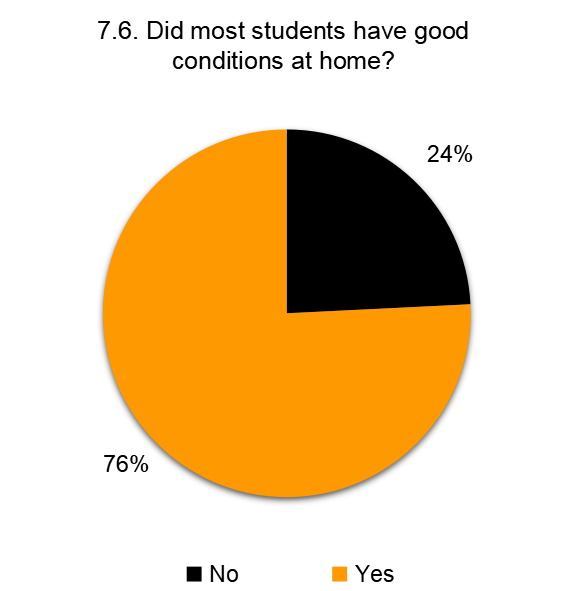
Fig. 19: Graph with the percentages of answers Yes and No for the question about whether the conditions in the students' home environment. Source: Authors, 2020.
5.5. Preliminary assessments
Finally, a block of questions was proposed for the respondents to prepare a preliminary assessment of the activities carried out. Faced with some statements, respondents should indicate their degree of agreement according to the scale I fully agree, I partially agree, I tend to disagree and I totally disagree.
Regarding the statement: The scale and scope of the exercise proved to be adequate for online activity, the option most indicated by the respondents was I partially agree, with 55% of the indications. On the other hand, the option with the lowest percentage of responses was I totally disagree, with 2 % of indications. The graph with the percentages is represented in figure 20.
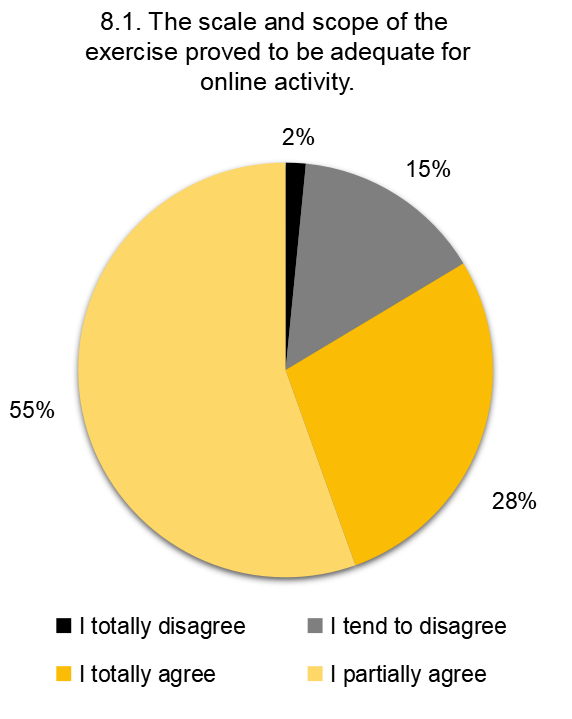
Fig. 20: Graph with percentages of responses from the preliminary assessment to the statement: The scale and scope of the exercise proved to be adequate for online activity. Source: Authors, 2020.
About the statement: Computer applications for design development were easily used by students, none of the options was indicated by at least half of the respondents. However, the two options with the highest percentage totaled 79% of the respondents, as those who partially agreed corresponded to 45% of respondents and I fully agree corresponded to 34%. The option with the lowest number of mentions was I strongly disagree, chosen by 6% of respondents. The distribution of all options is shown in the graph in figure 21.
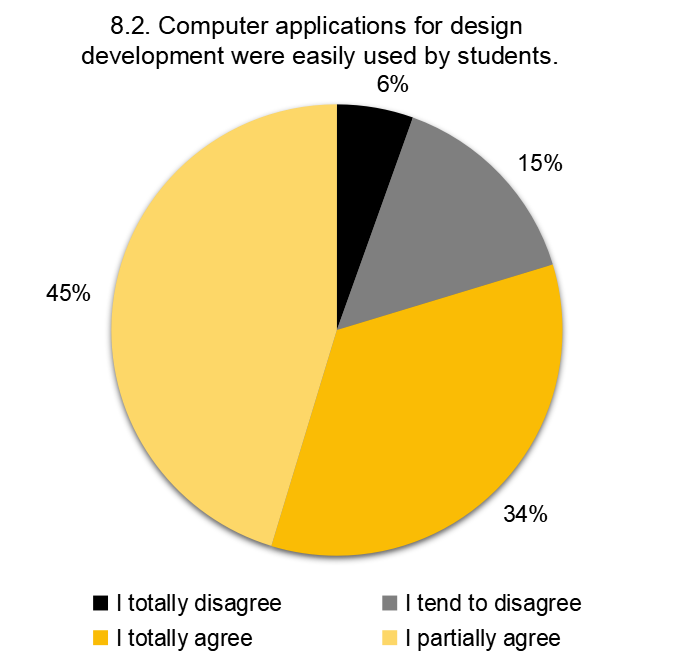
Fig. 21: Graph with percentages of responses from the preliminary assessment to the statement Computer applications for design development were easily employed by students. Source: Authors, 2020.
About the statement: The sessions with synchronous communication with the students were useful, 56% of the respondents indicated the option I fully agree with the statement. The option with the least respondents was I strongly disagree, indicated by 3%. The percentage of each option is shown in the graph in figure 22.
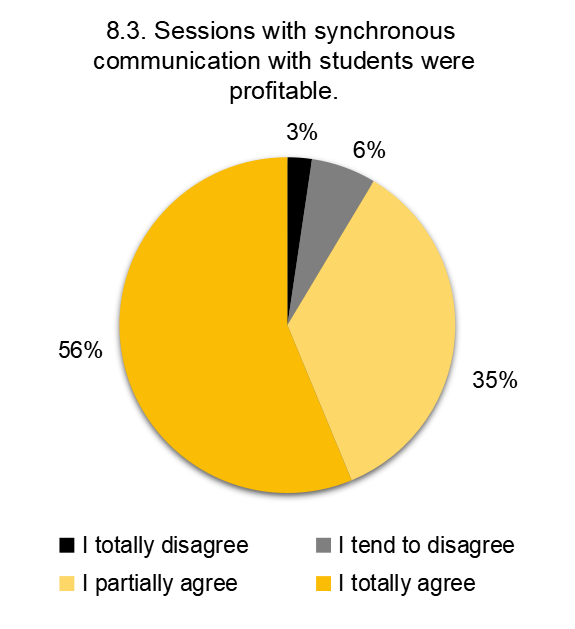
Fig. 22: Graph with the percentages of responses from the preliminary assessment to the statement The sessions with synchronous communication with the students were useful. Source: Authors, 2020.
About the statement: The objectives of the proposed activities have been achieved, none of the options were indicated by half of the respondents, but the options I fully agree and I partially agree totaled 94% of the indications, with percentages of 48% and 46% respectively. The option with the lowest number of mentions was I strongly disagree, being indicated by 1% of respondents. The graph with all percentages is shown in figure 23.
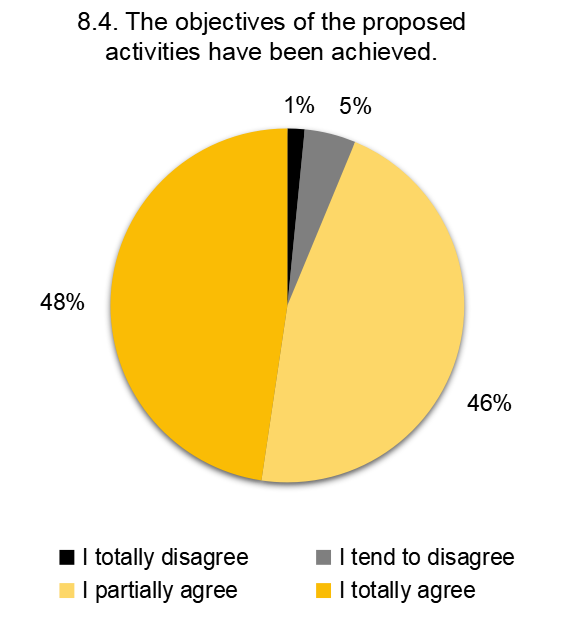
Fig. 23: Graph with the percentages of responses from the preliminary assessment to the statement The objectives of the proposed activities have been achieved. Source: Authors, 2020.
About the statement: Many losses were noticed compared to the face-to-face course, the alternative that had more respondents was I partially agree, indicated by 53% of respondents. On the other hand, the alternative with fewer respondents was I totally disagree, indicated by 6% of respondents. The complete graph for this statement is shown in figure 24.
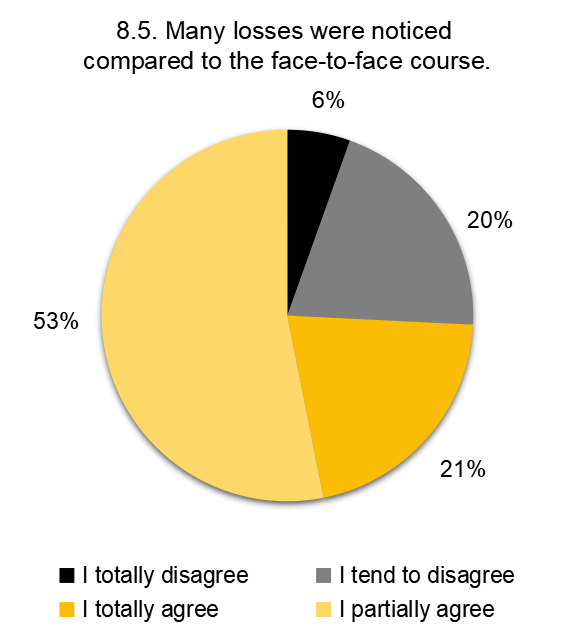
Fig. 24: Graph with the percentages of responses from the preliminary assessment to the statement Many losses were noticed compared to the face-to-face course. Source: Authors, 2020.
About the statement: Many gains were noticed compared to the face-to-face course, the most mentioned alternative was I partially agree, indicated by 50% of respondents. On the other hand, the alternative with the lowest number of mentions was I fully agree, indicated by 3% of respondents. The complete graph for this statement is shown in figure 25.
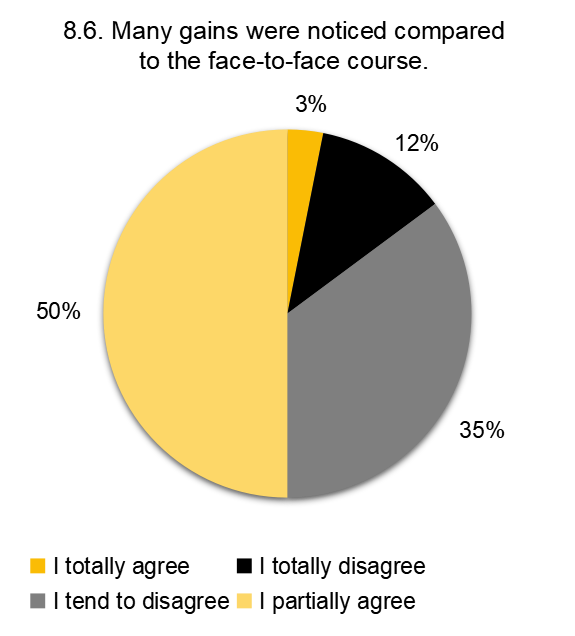
Fig. 25: Graph with the percentages of responses from the preliminary assessment to the statement There were many gains concerning the classroom discipline. Source: Authors, 2020.
About the statement: Most students were satisfied with the results of the activities, no option was indicated by at least a half of the respondents, but the addition of the options I fully agree and I partially agree account for 86% of respondents. Separately, they correspond to 46% and 40% of the respondents, respectively. The option with the lowest percentage of respondents was I strongly disagree, with 2%. The complete graph for this statement is shown in figure 26.
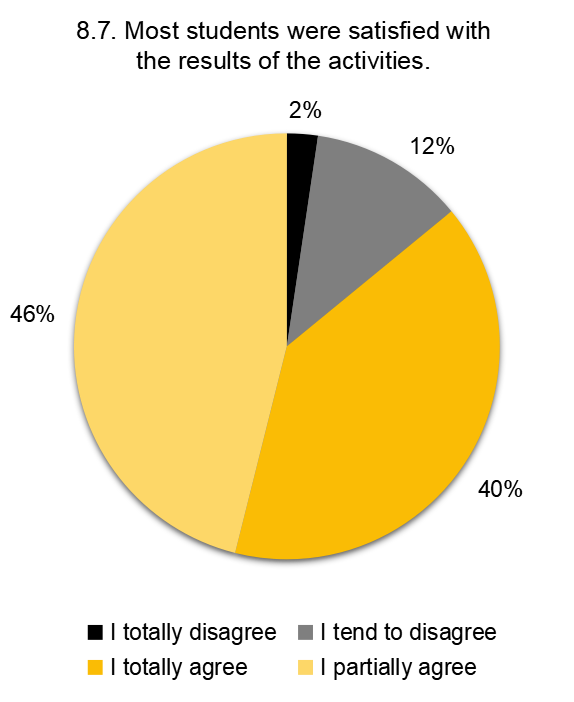
Fig. 26: Graph with the percentages of responses from the preliminary assessment to the statement Most students were satisfied with the results of the activities. Source: Authors, 2020.
About the statement: Teachers were satisfied with the results of the activities, none of the options were indicated by at least half of the respondents, but the options I strongly agree and I partially agree account for 80% of respondents. Separately, they correspond to 48% and 32% of the respondents, respectively. The option with the lowest percentage of respondents was I strongly disagree, with 4%. The complete graph for this statement is shown in figure 27.
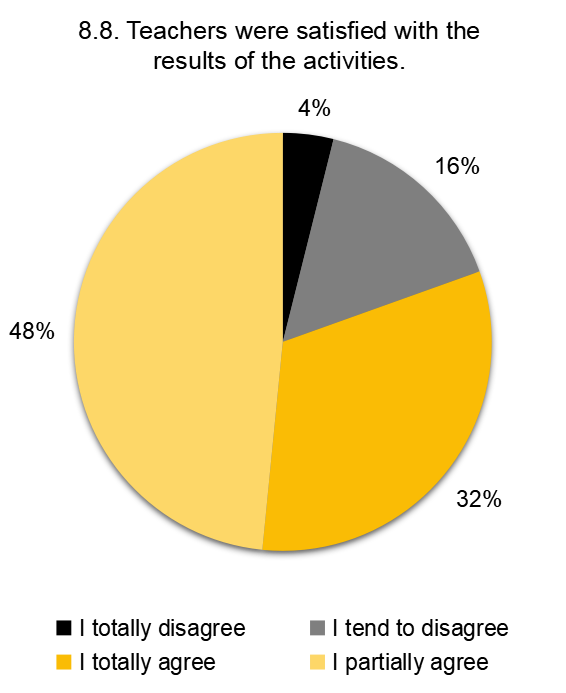
Fig. 27: Graph with percentages of responses from the preliminary assessment to the statement The teachers were satisfied with the results of the activities. Source: Authors, 2020.
About the statement: The drawings and models produced are of good quality, none of the options were indicated by at least half of the respondents, but the options I strongly agree and I partially agree account for 84% of respondents. They separately correspond to 47% and 37%, respectively. The option with the lowest percentage of mentions was I strongly disagree, with 1%. The complete graph for this statement is shown in figure 28.
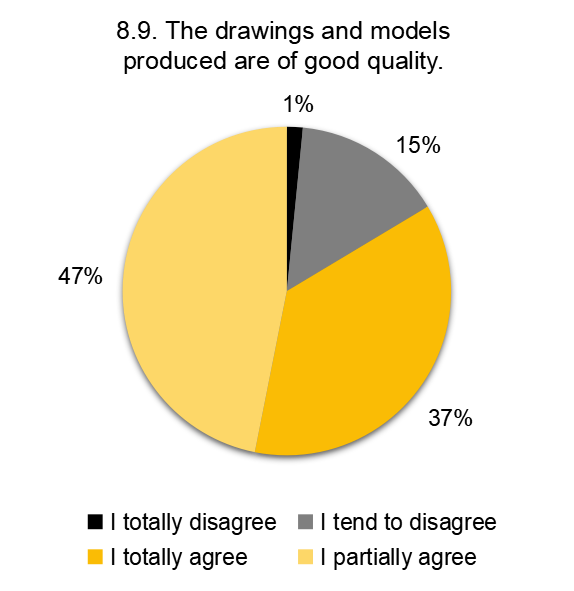
Fig. 28: Graph with percentages of responses from the preliminary assessment to the statement The graphic pieces produced are of good quality. Source: Authors, 2020.
About the statement: Drawings and models were produced in sufficient quantity, none of the options were indicated by at least half of the respondents, but the options I strongly agree and I partially agree account for 81% of respondents. They separately correspond to 43% and 38%, respectively. The option with the lowest percentage of mentions was I strongly disagree, with 4%. The complete graph for this statement is shown in figure 29.
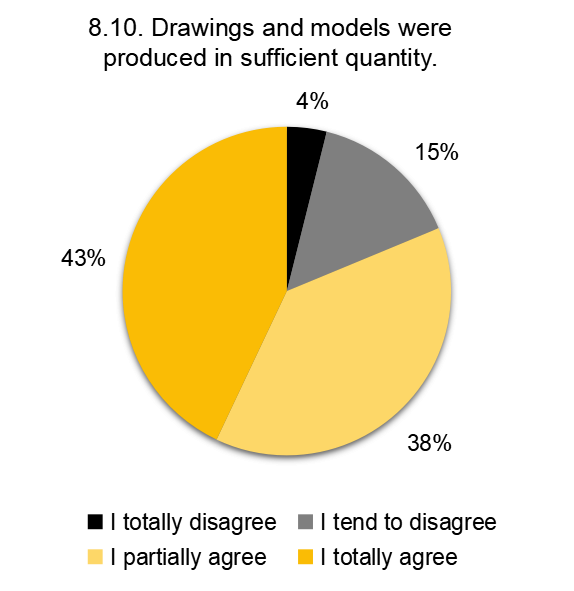
Fig. 29: Graph with the percentages of responses from the preliminary assessment to the statement The graphic pieces were produced in sufficient quantity. Source: Authors, 2020.
About the statement: The experience revealed that some online procedures could be integrated into face-to-face courses, none of the options were indicated by at least half of the respondents, but the options, I fully agree and I partially agree account for 81% of the respondents. They separately correspond to 43% and 38%, respectively. The option with the lowest percentage of respondents was I strongly disagree, with 1%. The complete graph for this statement is shown in figure 30.
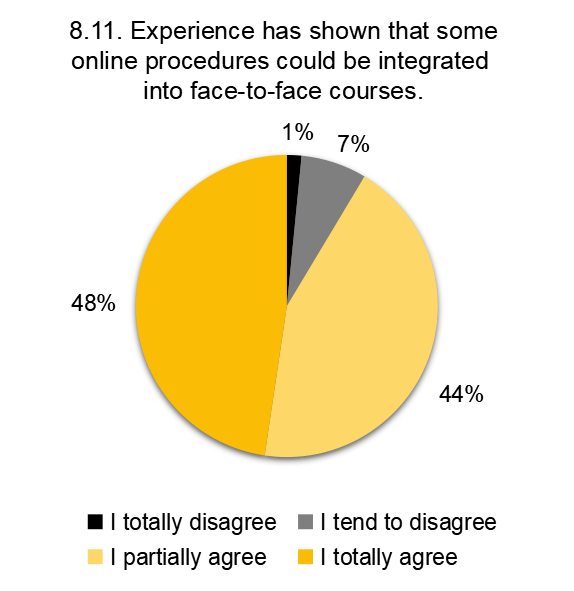
Fig. 30: Graph with percentages of responses from the preliminary assessment to the statement The experience revealed online procedures that could be incorporated into the face-to-face subjects. Source: Authors, 2020.
About the statement: The online course requires stricter procedures from all involved than a face-to-face course, none of the options were indicated by at least half of the respondents, but the options I strongly agree and I partially agree correspond to 80% of the respondents. They separately correspond to 43% and 37%, respectively. The option with the lowest percentage of respondents was I strongly disagree, with 5%. The complete graph for this statement is shown in figure 31.
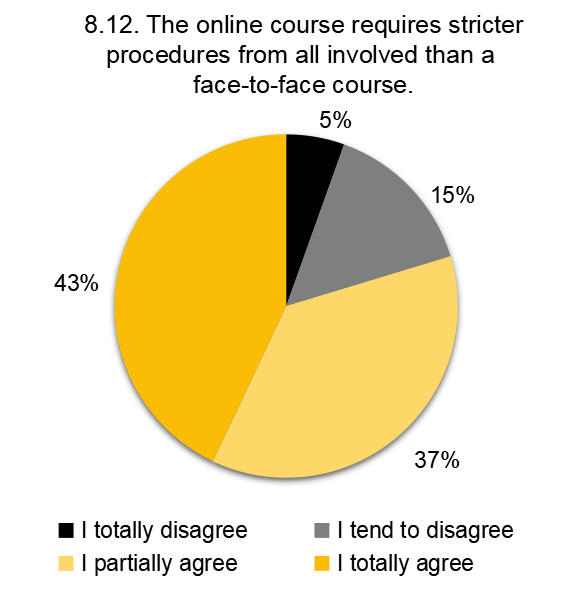
Fig. 31: Graph with the percentages of responses from the preliminary assessment to the statement The online course requires stricter procedures from all involved than a face-to-face course. Source: Authors, 2020.
6 Application surveys and experiments
Considering the written responses of interviewees from both Brazilian and international institutions, and collecting information from Nomads.usp researchers and their fellows, a set of applications2 were gathered for being designated as having qualities for remote design teaching. The listing of these applications allows identifying a varied set of programs able to potentially respond to demands such as representation, modeling, and synchronous communication, even though not always simultaneously.
In architectural design processes and considering the role of representation, the model, and collective discussions during the design process, applications have been selected that went through an exploratory phase conducted by the researchers' team. Explorations took place individually, for applications with no possibility of collaborative work, or with other researchers if there was a possibility for collective and/or collaborative work. Table 1 shows the set of computer applications tested in the scope of the RDS project.
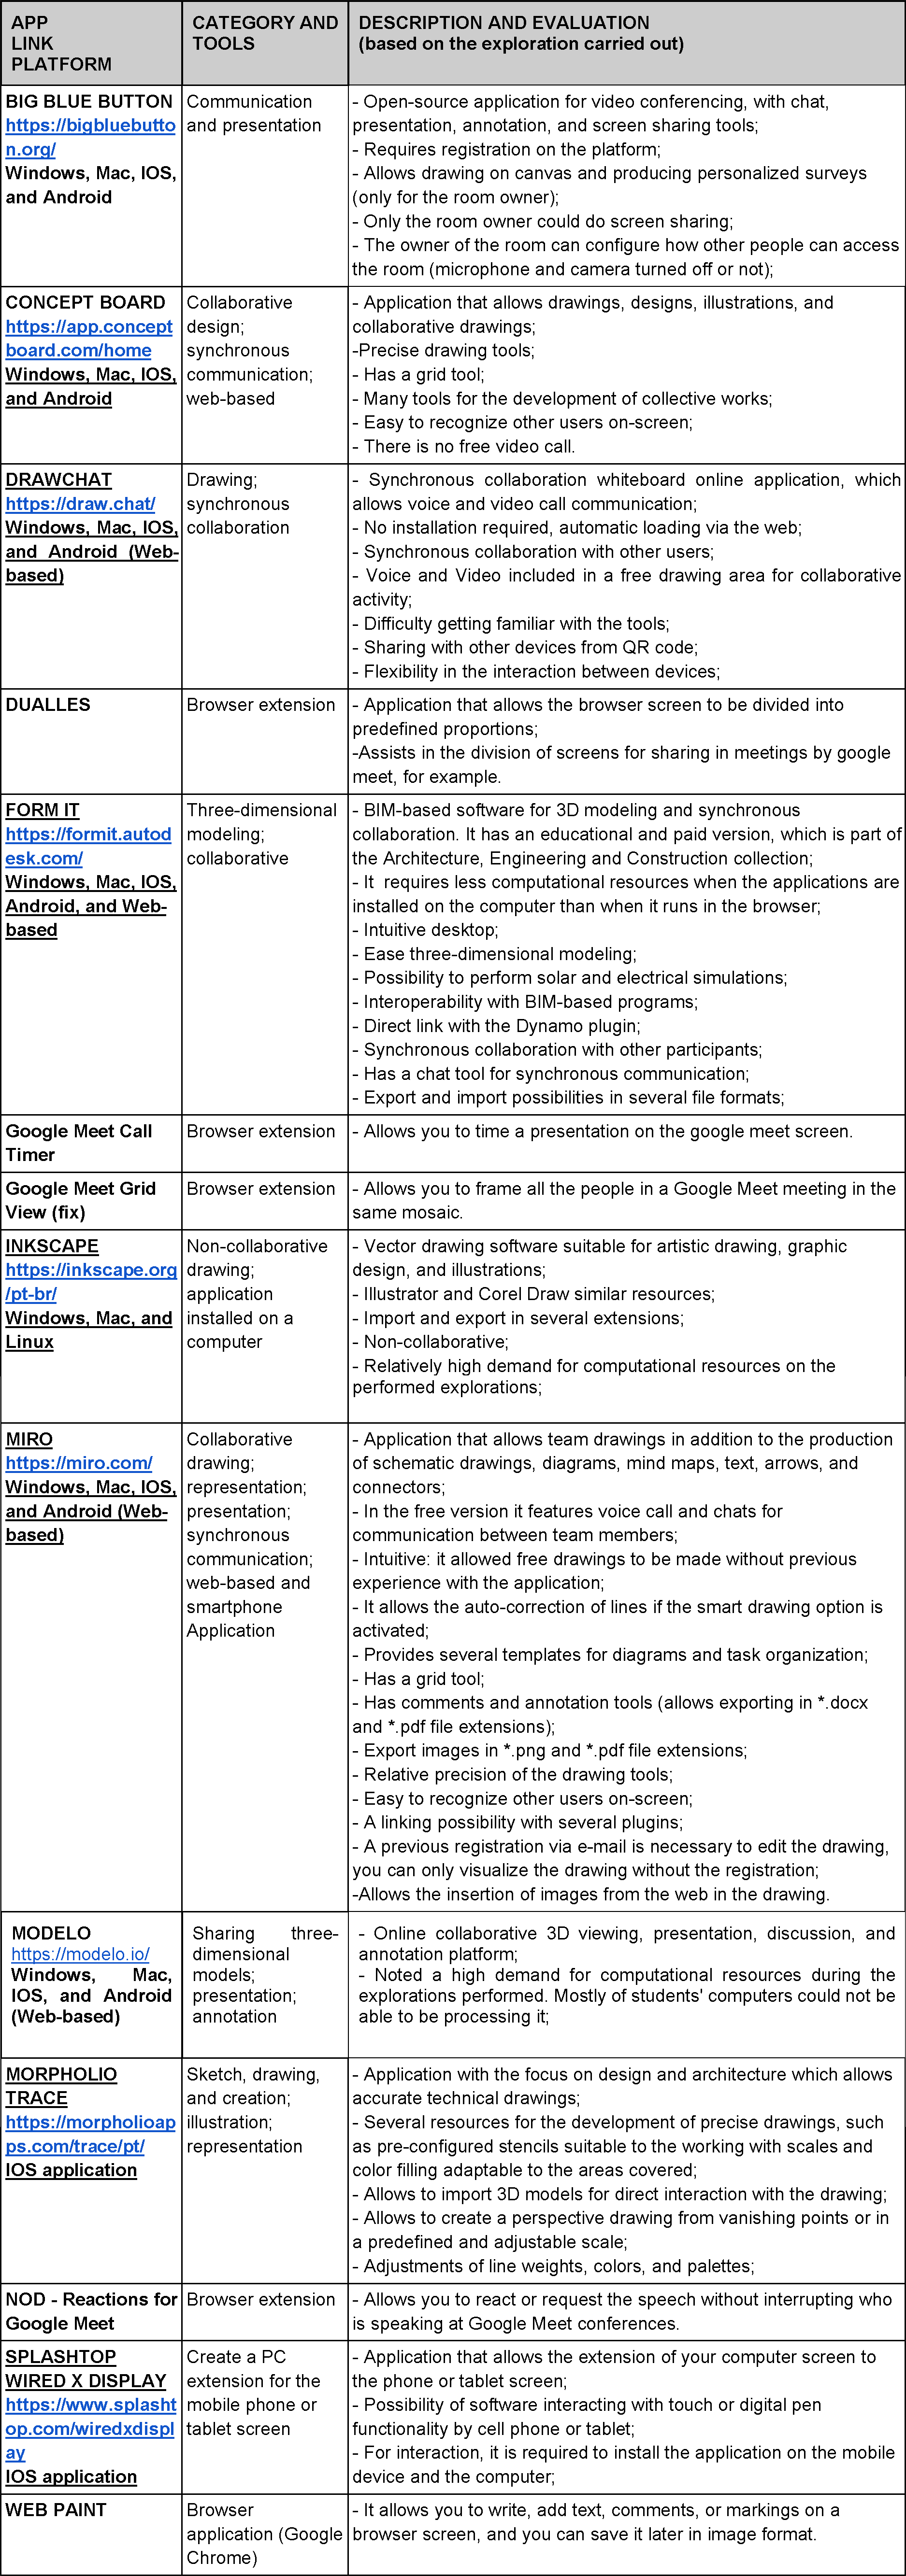
Table 1: Tested applications. Source: Authors, 2020.
In the set of tested applications, it was not possible to find anyone that satisfactorily provided means of representation, modeling, and synchronous communication, simultaneously in a free version. However, a solution that proved to be interesting was to associate two or more applications, for example, videoconferencing via Google Meet, for communication, and Miro application, for the construction of collaborative sketches and drawings. In this case, the research explorations involved video calls to collaboratively produce drawings that typically can be developed in teaching environments of architectural design, such as plans, sections, and contour lines.
We also investigated whether the applications would have other features, in addition to the usual basic lines and shapes, that could assist in work sessions during design processes. For example, features of the collaborative design application Miro allowed adding comments and mentioning collaborators that can be stored or resolved asynchronously, if necessary. In this application, it was also possible to add images or screenshots by inserting web links. The images could then be discussed, commented on, and changed in the Miro environment using available drawing resources.
Another exploration involved applications that allow you to extend the screen from personal computers to tablets, as the aim was to use the tablet or other mobile devices like a graphics tablet. This exploration was motivated by the fact that students or teachers of design courses could have an easier time drawing by hand, and this could be done with specific pens of digital design or with the finger, for example.
Explorations using different applications have shown that it is possible to carry out activities that allow the communication and production of graphic and representation pieces synchronously. The tested applications were all used in versions that would have no cost to participants, free software versions were used, or at least some free version was used (in this case it was the version that was explored), or educational versions.
Although the applications explored should not cost participants, the initial survey resulted in a large number of applications, free and paid. The complete list of applications raised, but which have not been tested, corresponds to table 2.
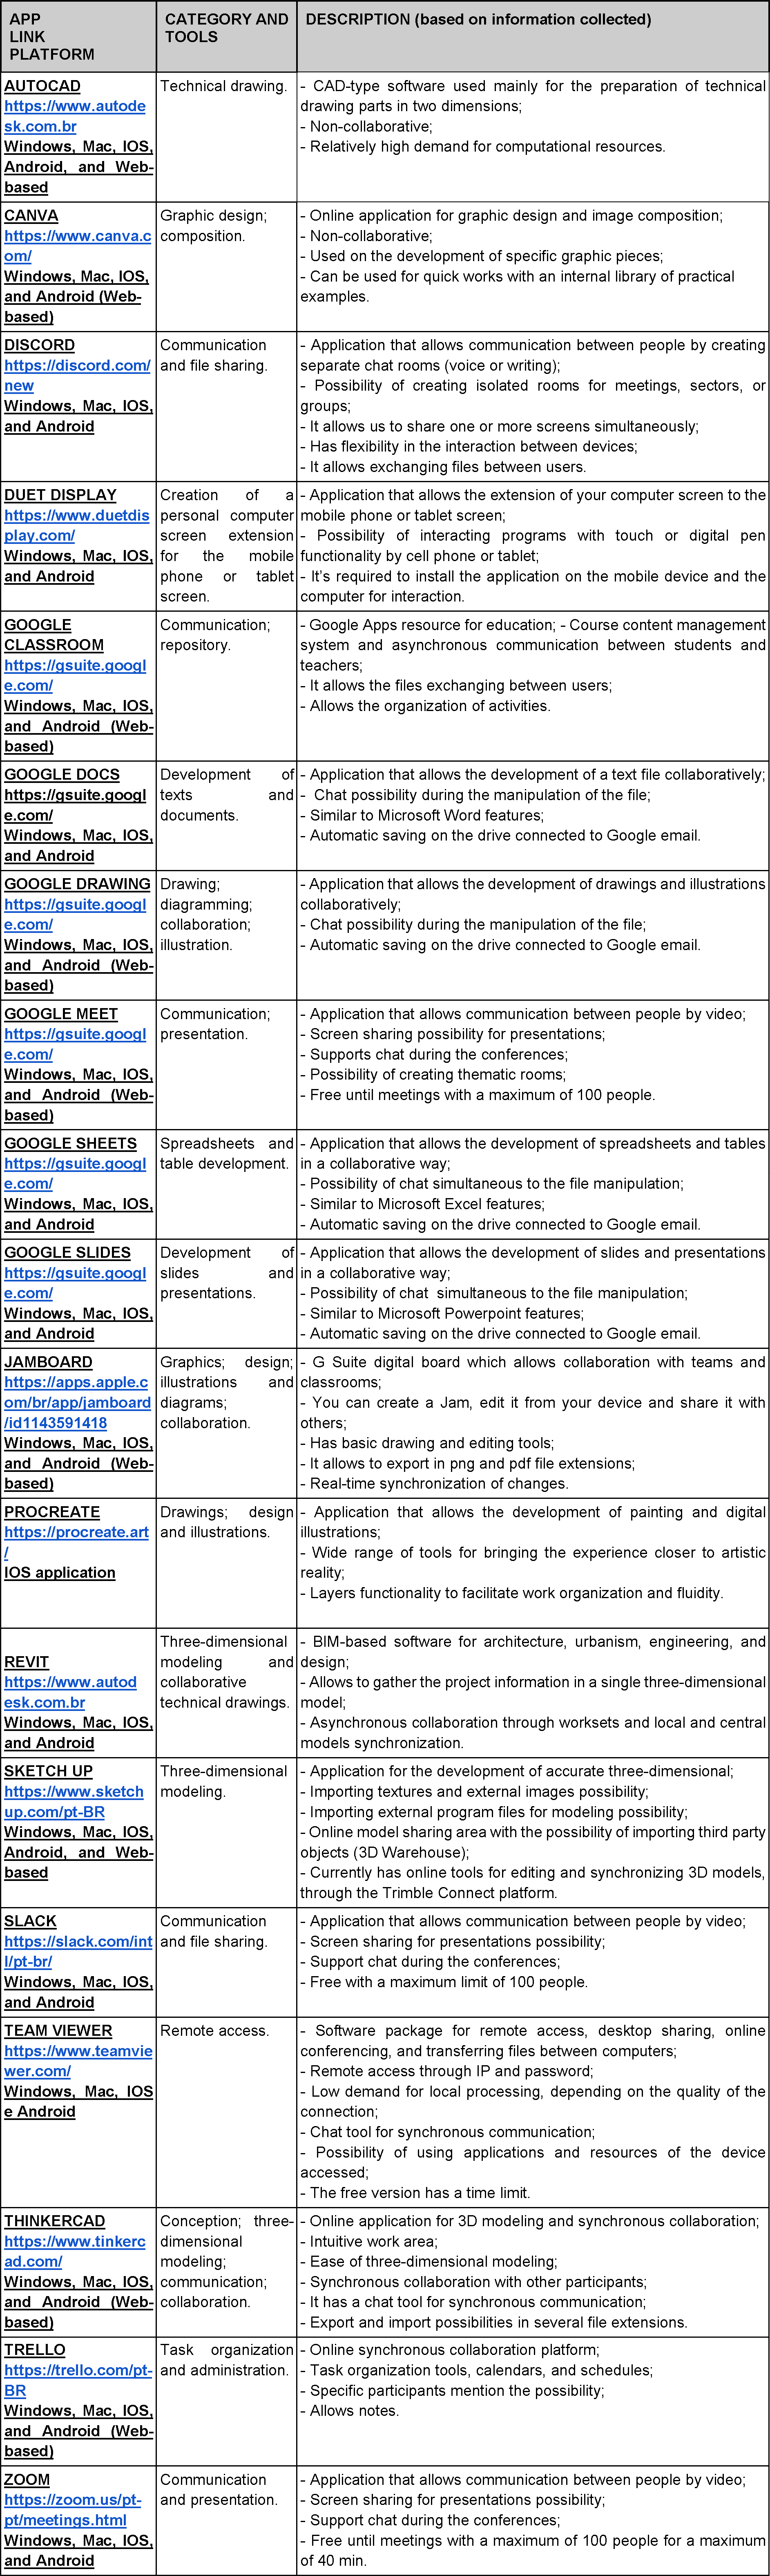
Table 2: Non-tested applications. Source: Authors, 2020.
7 Products
According to the third specific objective of the Remote Design Studio project, the Nomads.usp researchers sought to stimulate dialogue about remote design teaching in academic forums both internal and external to the Institute of Architecture and Urbanism - IAU-USP. Such dialogue took place through the dissemination of results and training sessions on the use of applications and websites. In both cases, the participants were able to comment and discuss the data, results, and reflections presented.
The dissemination of research results began between mid-July and August 2020, extending to the present.
i. Presentation of the partial results of the research to Nomads.usp researchers, at the August 2020 general meeting;
ii. Presentation of partial raw data to IAU-USP Architectural Design professors in the format of a Prompt Report. Preliminary data from the questionnaire, tested applications, and reflections on remote education were presented based on the written responses received so far;
iii. Lecture by researcher Mario Vallejo in the conference cycle organized by the Coletivo de Estudiantes de la Sociedad Colombiana de Arquitectos Regional Tolima - CESCA TOLIMA. The conference was attended by professors, some respondents to the questionnaire, and students of Architecture courses in Latin American countries;
iv. Scientific article "Remote online, project teaching: lessons from a pandemic" published at the Arquitextos journal (Portuguese only), discussing the research results. (Tramontano, et al., 2020);
v. Conducting training sessions on the use of computer applications and websites, at IAU-USP, for students and teachers.
The training sessions were held after the exploratory research activities and took place at the institutional level. Three training sessions were held for teachers and trainee graduate students in the Teaching Improvement Program at IAU-USP. The sessions covered the Miro, FormIt, Inkscape programs, as well as Google Meet extensions for browsers. Two other training sessions were also held, but for undergraduate students of the Architecture and Urbanism and Civil Engineering courses within the scope of the courses IAU 0734 - Project III-B and IAU 0412 - Architecture and Urbanism II, which focused solely on the use of the Miro application.
References
Behar, P. A., 2020. O Ensino Remoto Emergencial e a Educação a Distância. UFGRS. Available at: https://www.ufrgs.br/coronavirus/base/artigo-o-ensino-remoto-emergencial-e-a-educacao-a-distancia/. Accessed 9 Dec. 2020.
Brasil. Ministry of Education. Portaria nº 343, 17th Mar. 2020. National Press. Available at: https://www.in.gov.br/en/web/dou/-/portaria-n-343-de-17-de-marco-de-2020-248564376. Accessed 9 Dec. 2020.
Crabié, M., 2020. Le télétravail en agence d'architecture, quand l'émulation collective n'y est pas. In: Tema.archi [online]. 9 de junho de 2020. Available at: http://tema.archi/articles/le-teletravail-en-agence-d-architecture-quand-l-emulation-collective-n-y-est-pas-1. Accessed: 10 Oct 2020.
Tramontano, M., Vallejo, M., Silva Filho, M. J., Medeiros, D. C., 2020. Remoto online, ensino de projeto: lições de uma pandemia. Arquitextos [online]. 247.05. December, 2020. (Portuguese only). Available at: https://www.vitruvius.com.br/revistas/read/arquitextos/21.247/7967. Accessed: 14 Dec. 2020.
Unesco. International Institute for Higher Education in Latin America and the Caribbean, 2020. COVID-19 and higher education: Today and tomorrow. Available at: http://www.iesalc.unesco.org/en/wp-content/uploads/2020/05/COVID-19-EN-130520.pdf. Accessed 9 Dec. 2020.
1 In Brazil, it is usual for the academic year to coincide with the calendar year, divided into 1st semester (from January to June) and 2nd semester (from July to December). Recesses usually occur between mid-December of one year to the end of January of the following year and in July. Because of the pandemic, several institutions had to readjust their calendars so that in some cases the school year no longer coincided with the calendar year.
2 We call computer applications the computational means gathered in the research work, including (but not restricted to) computer programs, video call interfaces, digital platforms, and browser extensions.